
April 1, 2021 Spring and Summer Streamflow Forecasts
Upper Missouri Basin
The high elevation snow pack in the Upper Missouri Basin as of April 1
was near to below average. The snow pack in the St. Mary Basin was 92 percent, and the
Milk River Basin was 76 percent.
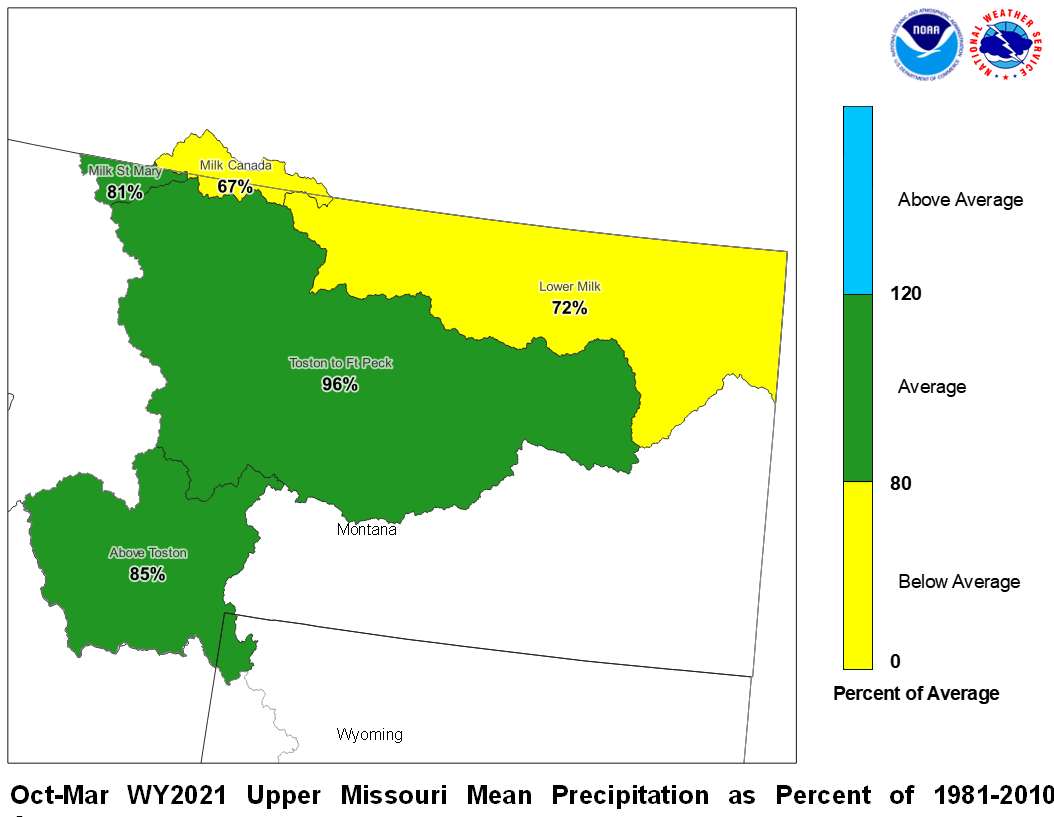
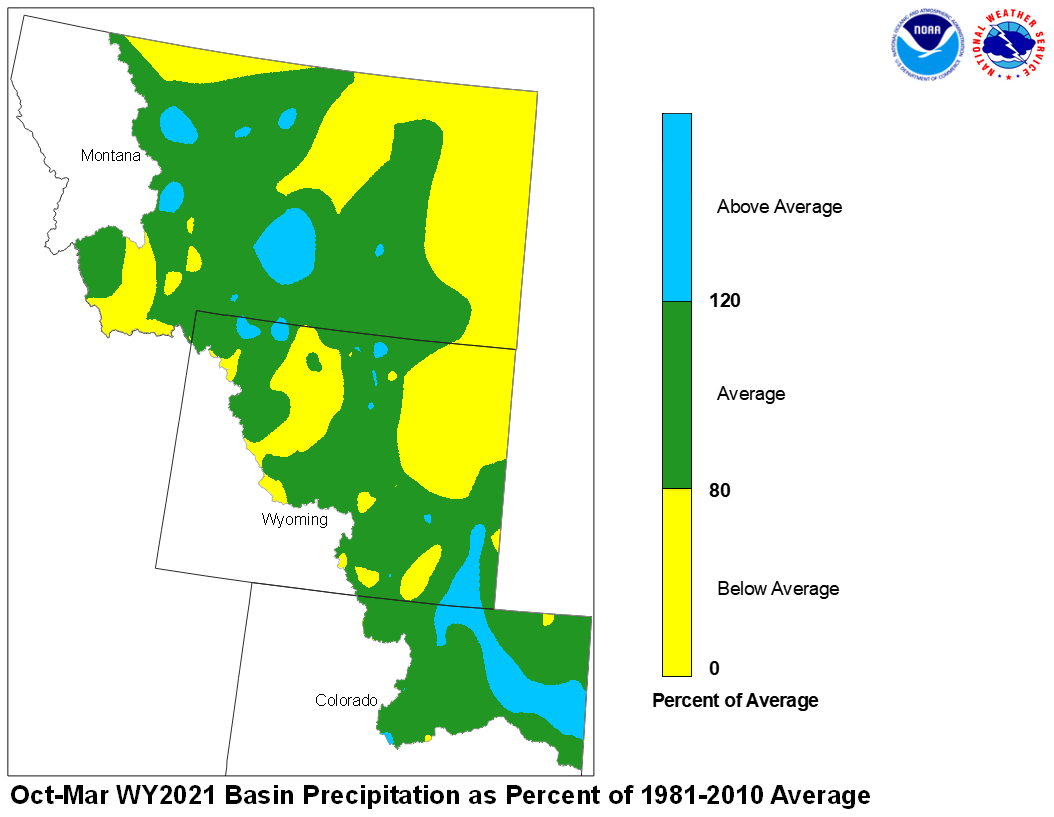
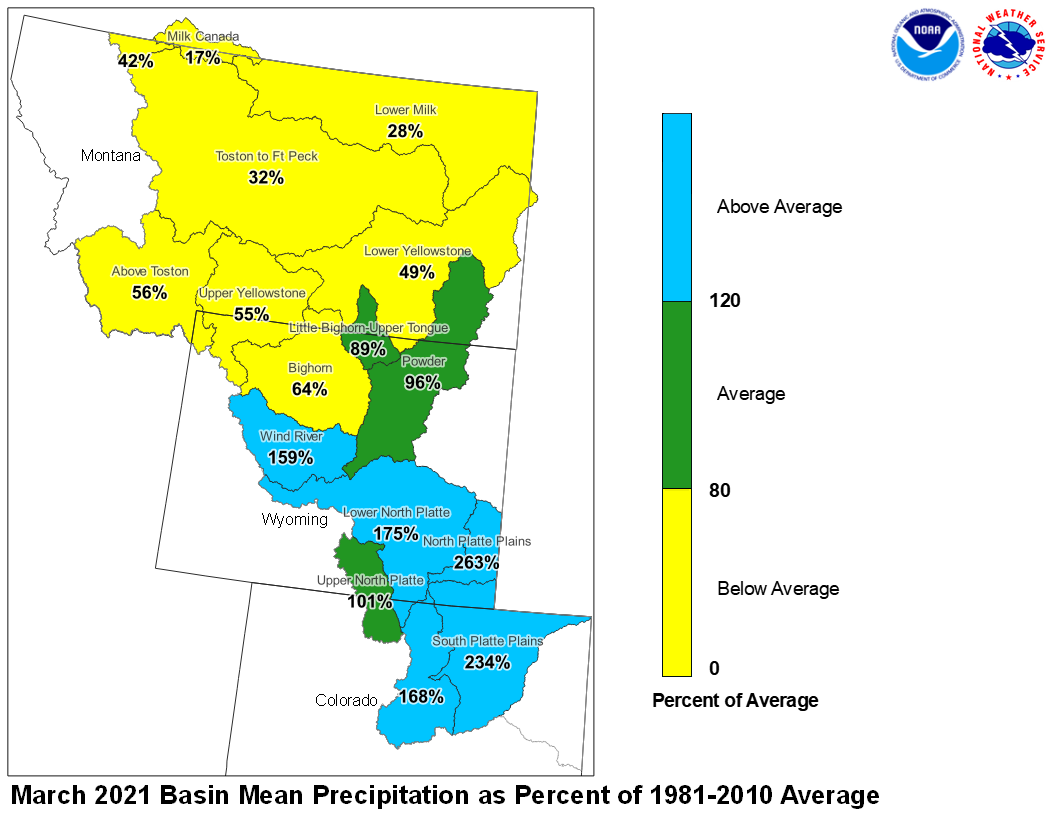
March precipitation across the Upper Missouri Basin was below average.
Basin precipitation summaries for the Missouri Basin include: Milk St. Mary,
42 percent; Milk Canada, 17 percent; Lower Milk, 28 percent; above Toston,
56 percent; Toston to Ft. Peck, 32 percent.

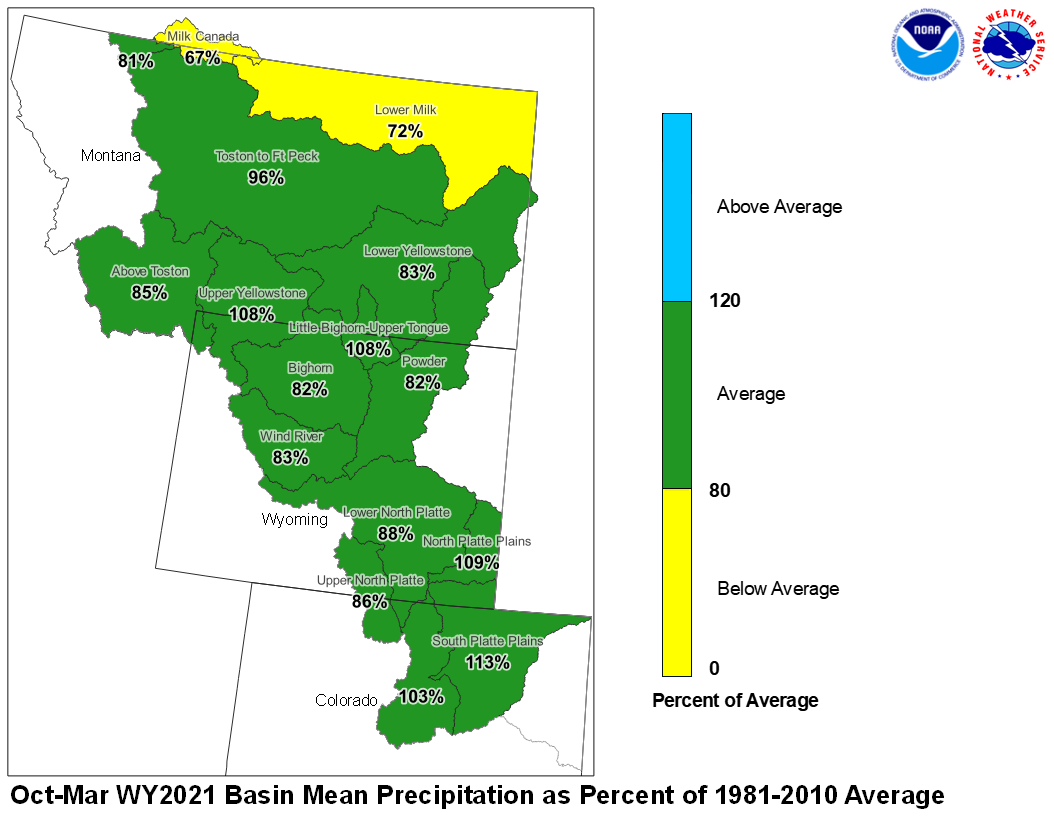
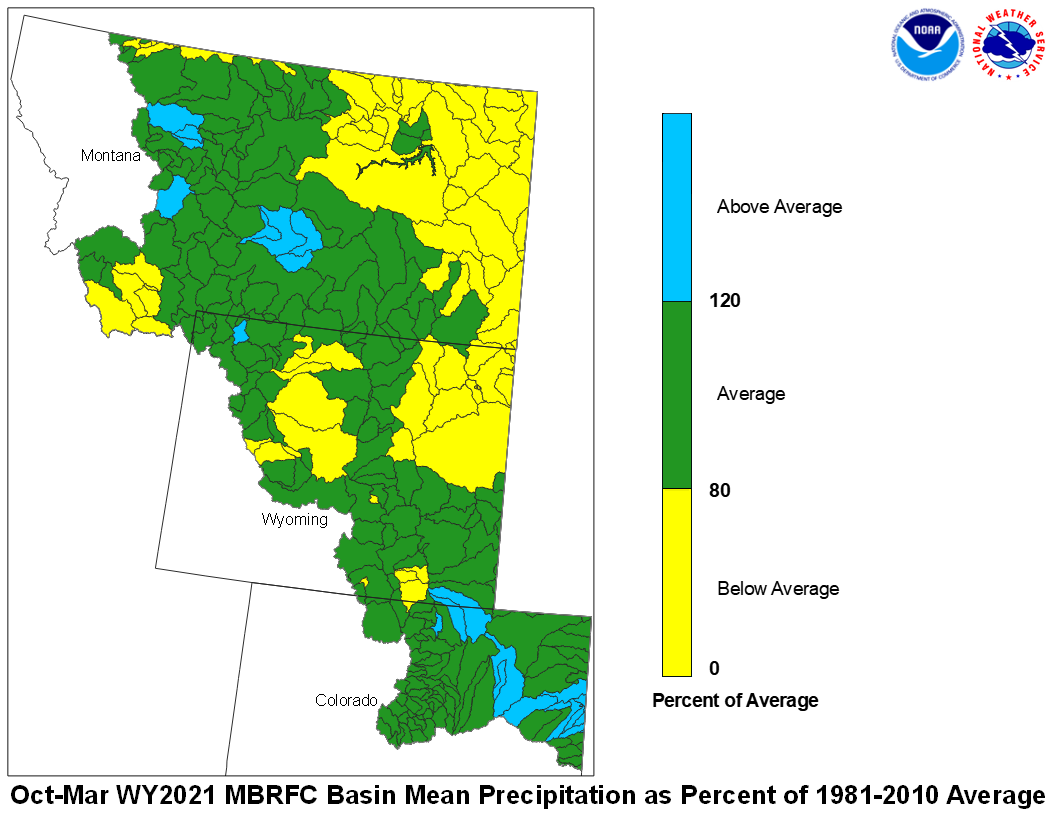
March 2021 Upper Missouri Mean Precip Oct-Mar WY2021 Upper Missouri Mean Precip
Stream flow in the Upper Missouri Basin is forecast to be
below average during the upcoming Spring and Summer.
The St. Mary River is forecast to have 72 percent of average
April-September flows. Runoff is expected to range around
82 percent of average for the Missouri Basin above Fort Peck,
Montana.

Upper Missouri April 1, 2021 Spring and Summer Streamflow Forecasts
Of the four major irrigation reservoirs in Montana; Lima
Reservoir had 127 percent average storage, Clark Canyon was
holding 105 percent of average water, Gibson Reservoir had 68
percent of average stored water, and Fresno Reservoir had
64 percent of average stored water.
Yellowstone Basin
The high elevation snow pack in the Yellowstone Basin was near average
on April 1. The snow pack in the Upper Yellowstone Basin was 101 percent
of average. The snow packs in the Wind, Bighorn, and Shoshone Basins were 96,
98, and 97 percent of average, respectively. The snow packs in the Tongue
and Powder basins were 103 and 119 percent of average, respectively.
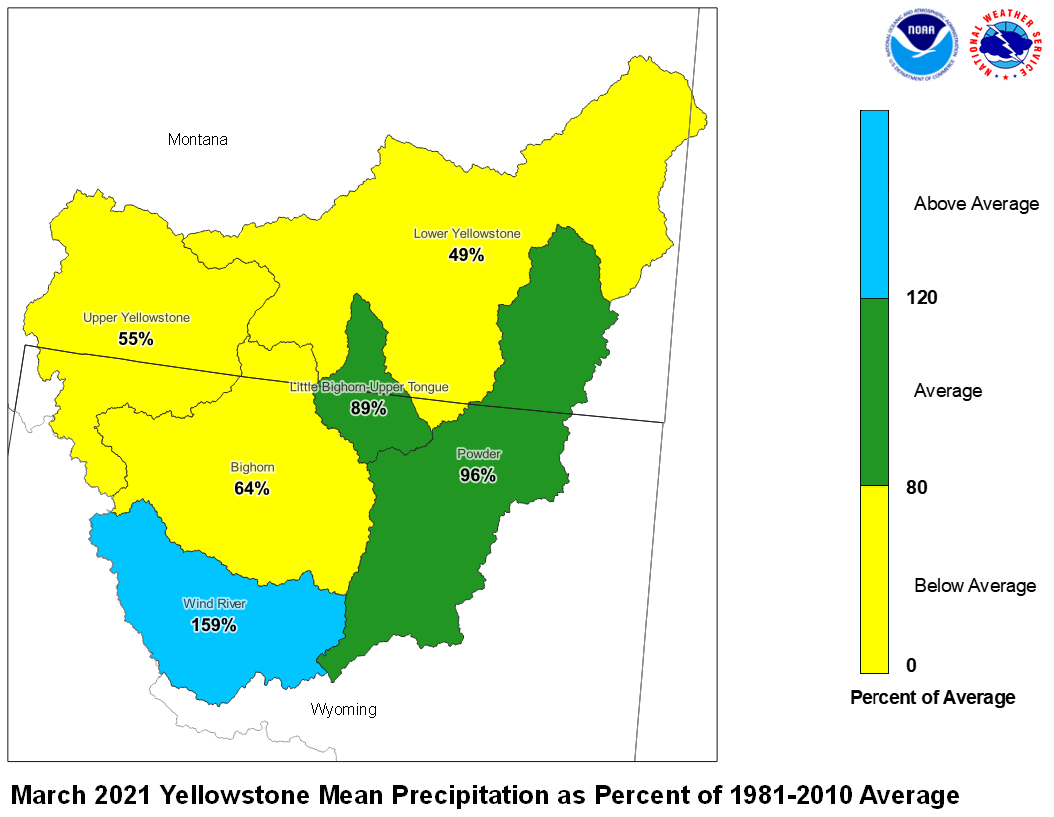
Precipitation during March was below average. The upper Yellowstone
River Basin received 55 percent of average precipitation while the
Lower Yellowstone River Basin reported 49 percent of average. The
Bighorn Basin received 64 percent of average precipitation while the
Wind River Basin received 159 percent of average. The Little Bighorn -
Upper Tongue Basin received 89 percent of average and the Powder River
had 96 percent of average precipitation.
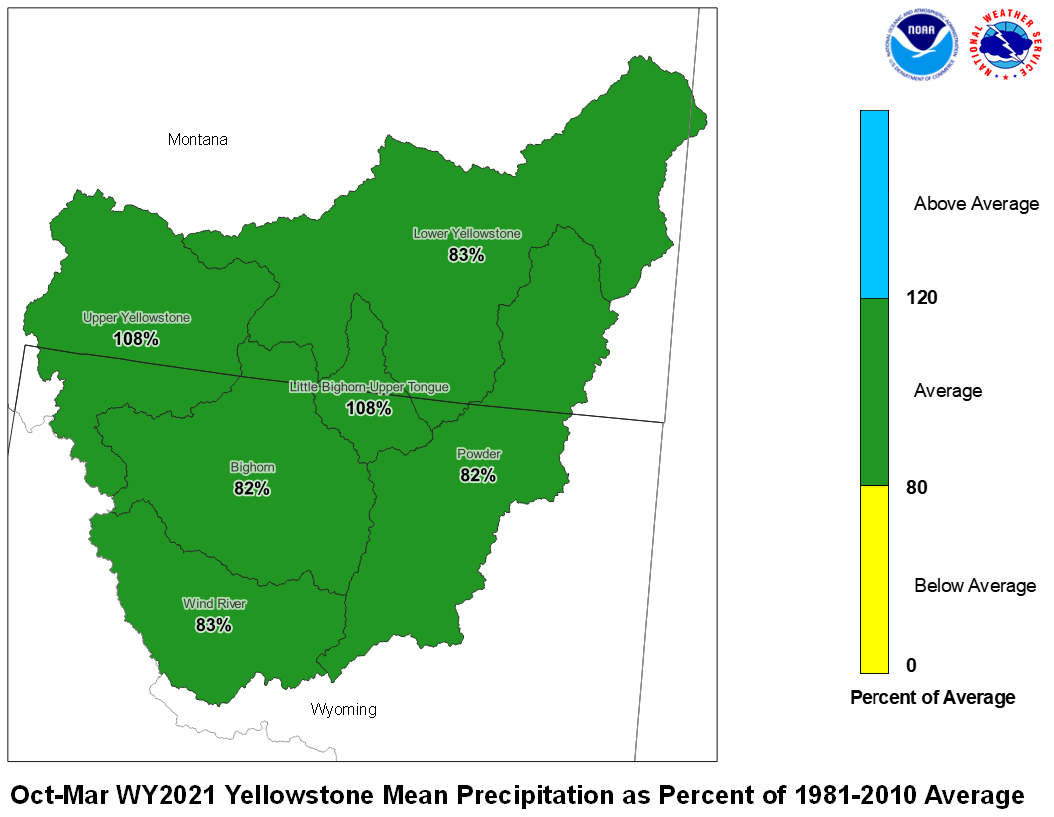
March 2021 Yellowstone Mean Precip Oct-Mar WY2021 Yellowstone Mean Precip
Forecast stream flow in the Yellowstone Basin is below average
for the upcoming Spring and Summer. Stream flow for the
Yellowstone River above Sidney, Montana is forecast to be about
75 percent of average. Flow in the Tongue Basin is expected to be
68 percent of average. Flows in the Powder River are expected
to be about 63 percent of average.
Monthend storage at Boysen Reservoir was 107 percent of average.
Stored water in Buffalo Bill Reservoir was 131 percent of average.
Monthend storage was 102 percent of average at Bighorn Reservoir.
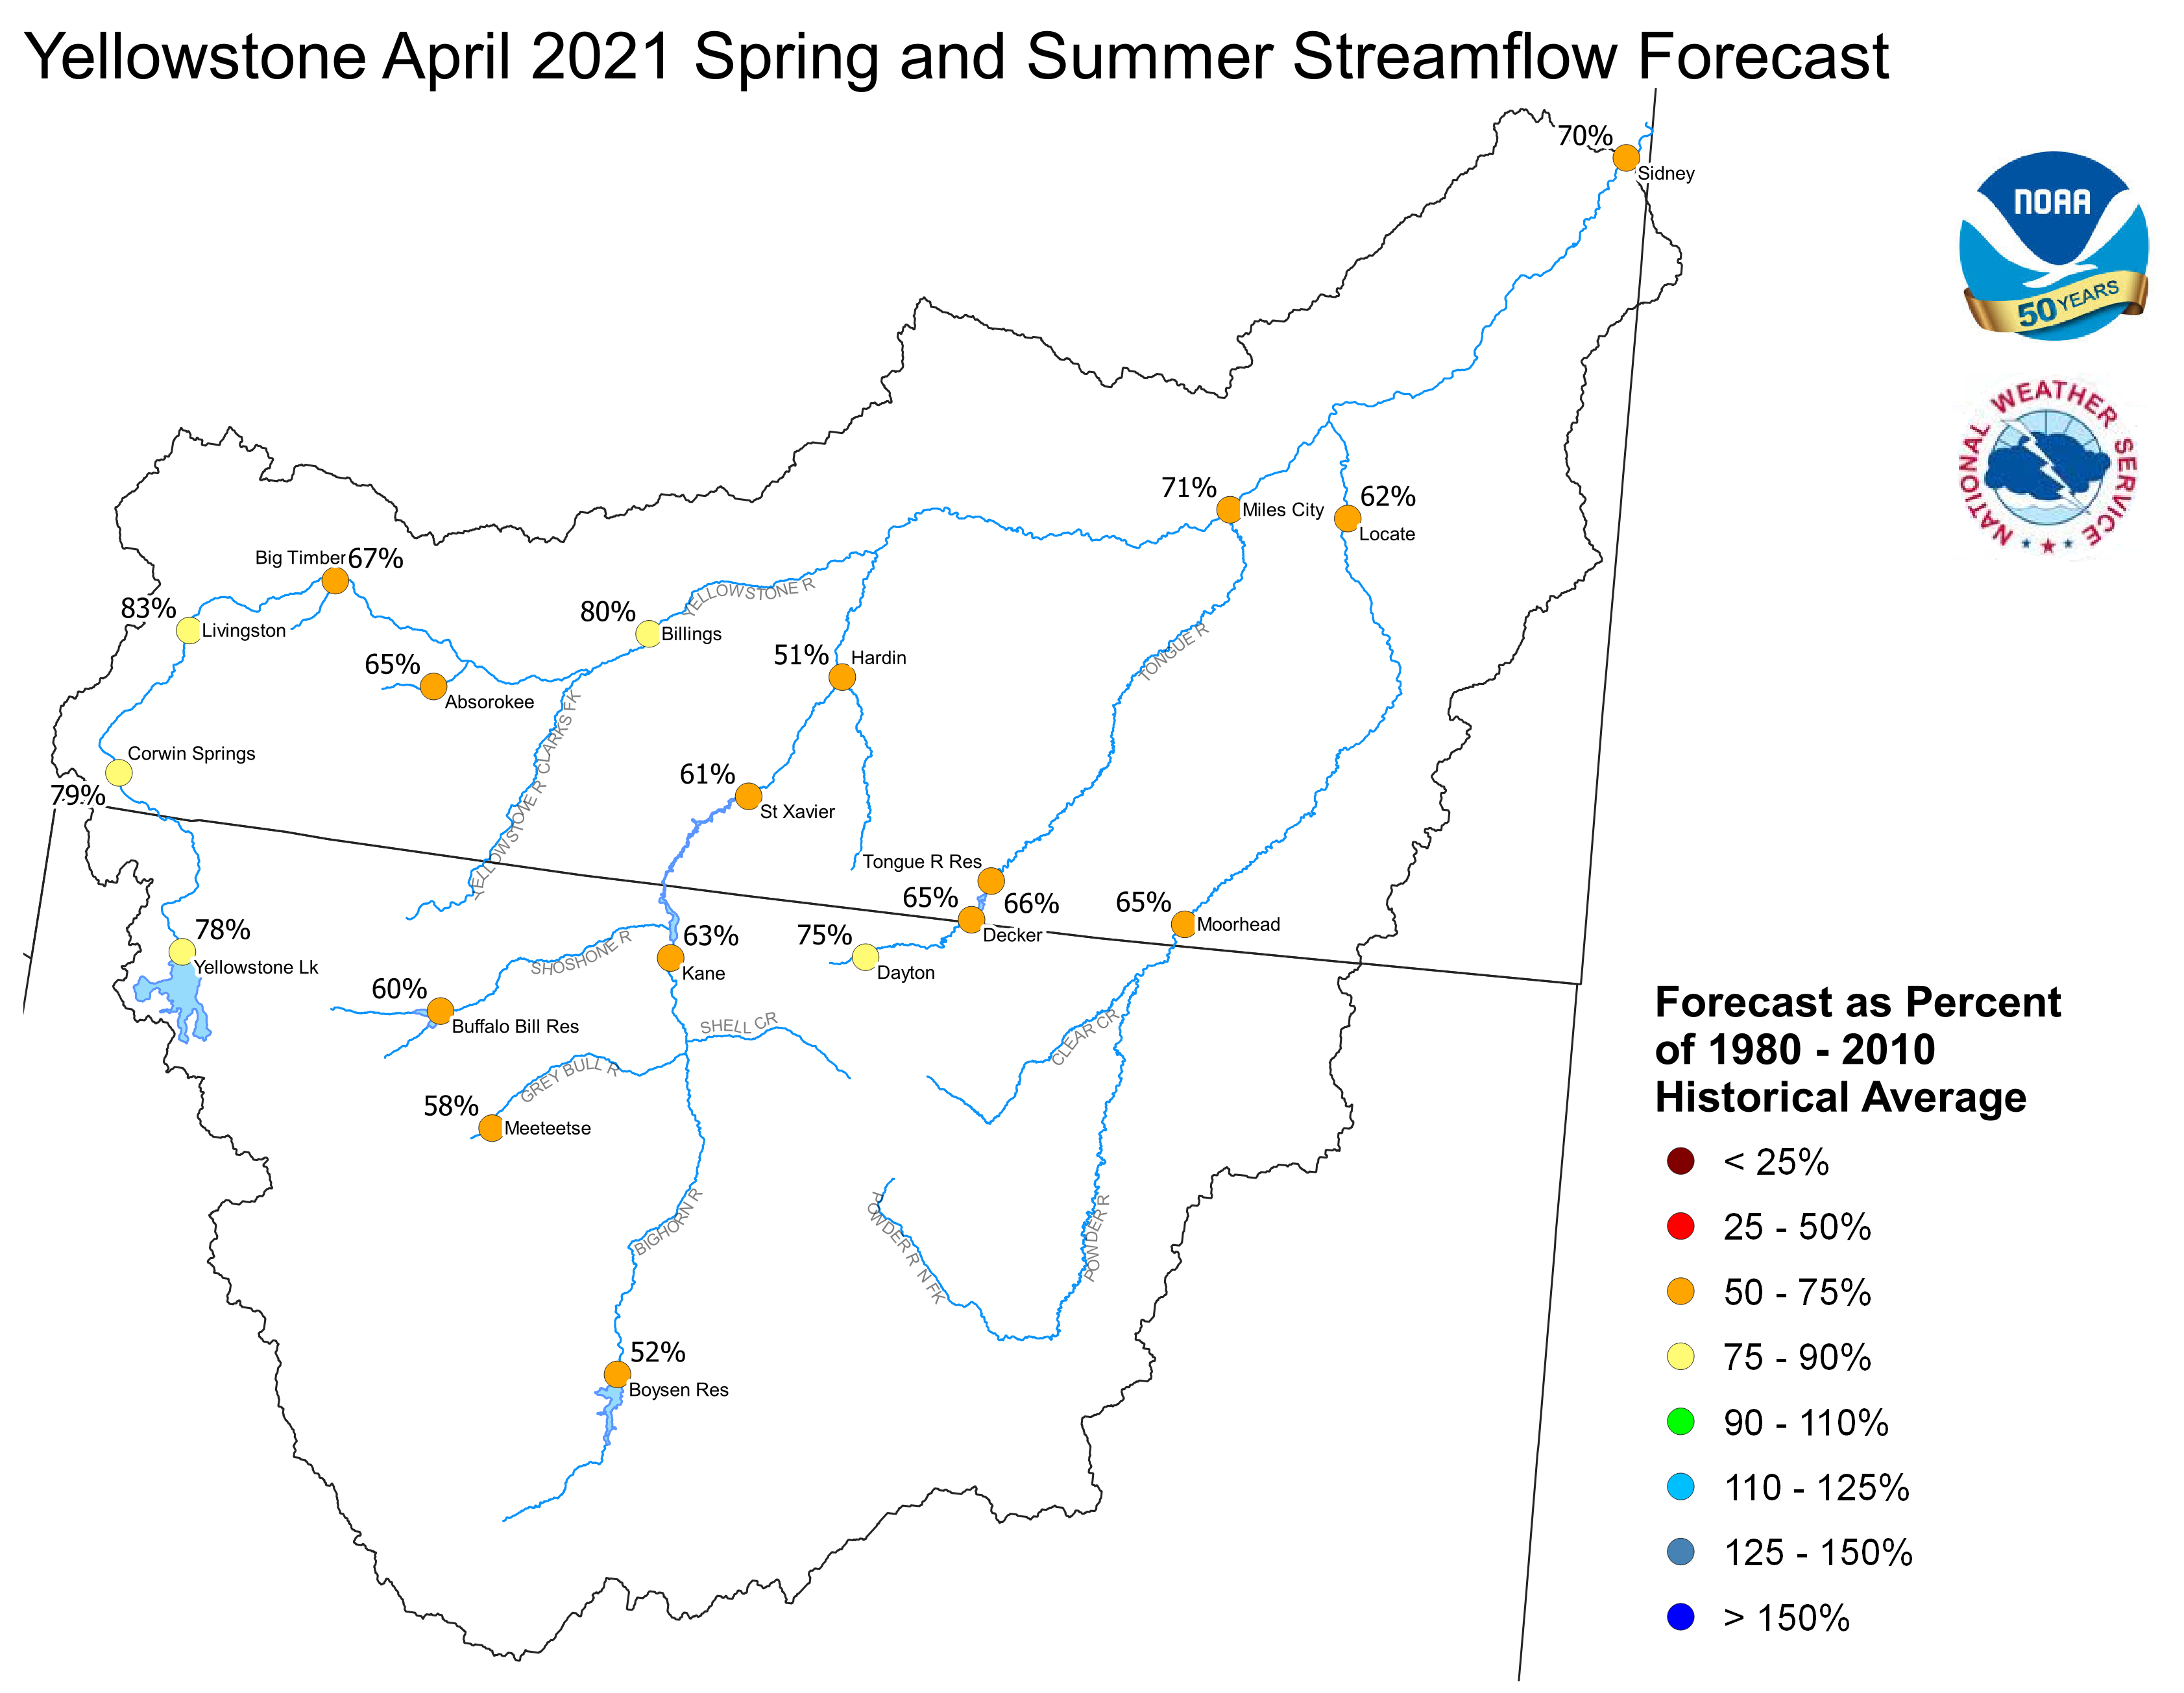
Yellowstone April 1, 2021 Spring and Summer Streamflow Forecasts
Platte Basin
The high elevation snow pack in the Upper North Platte Basin was
97 percent of average on April 1. The snow pack in the North Platte
Basin below Seminoe Reservoir was 119 percent of average. The snow
pack in the South Platte Basin was 101 percent of average.
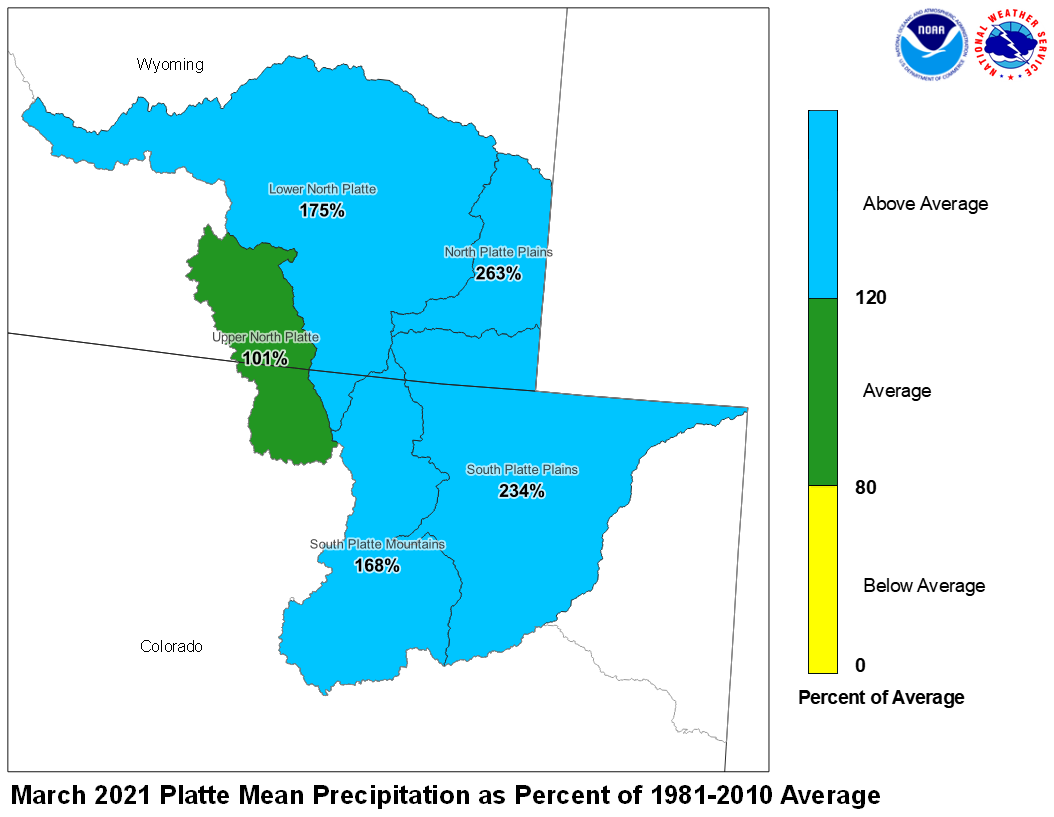
Precipitation during March in the Upper North Platte Basin was 101
percent of average. In the Lower North Platte Basin, precipitation
was 175 percent of average. The North Platte Plains below Guernsy
Reservoir had 263 percent. The South Platte Mountains had 168
percent whereas the Plains had 234 percent of average December
precipitation.
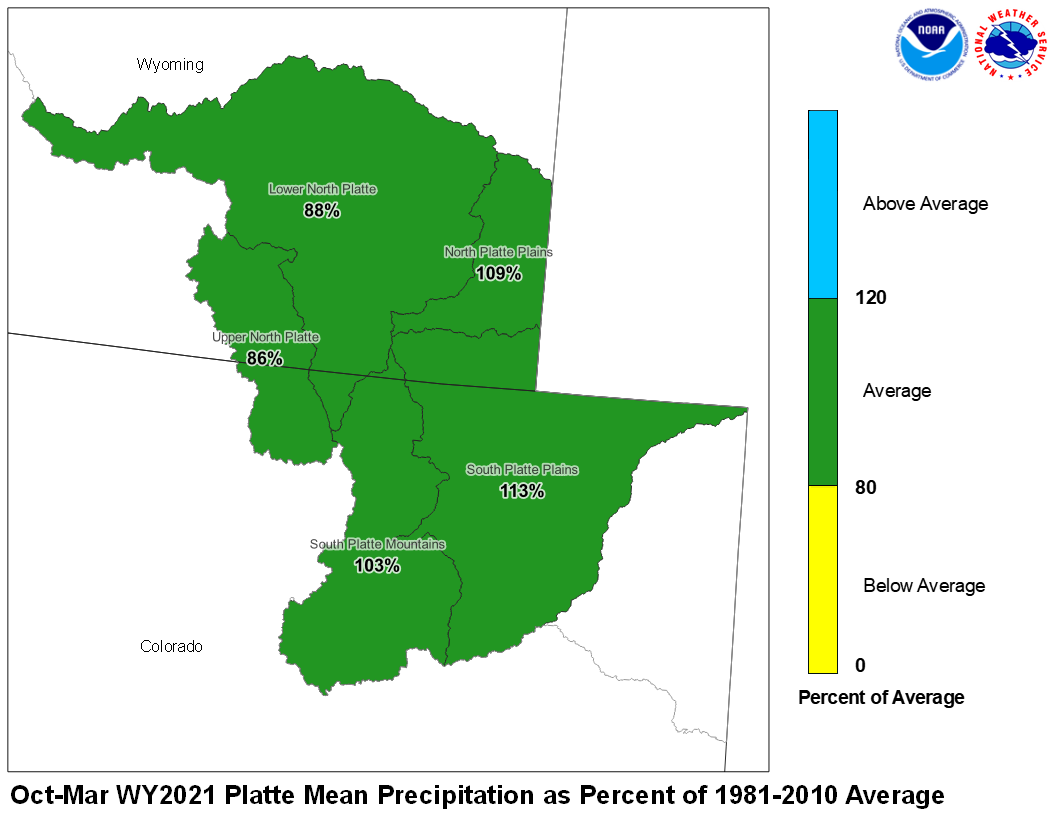
DecemberFebruary 2021 Platte Mean Precip Oct-Mar WY2021 Platte Mean Precip
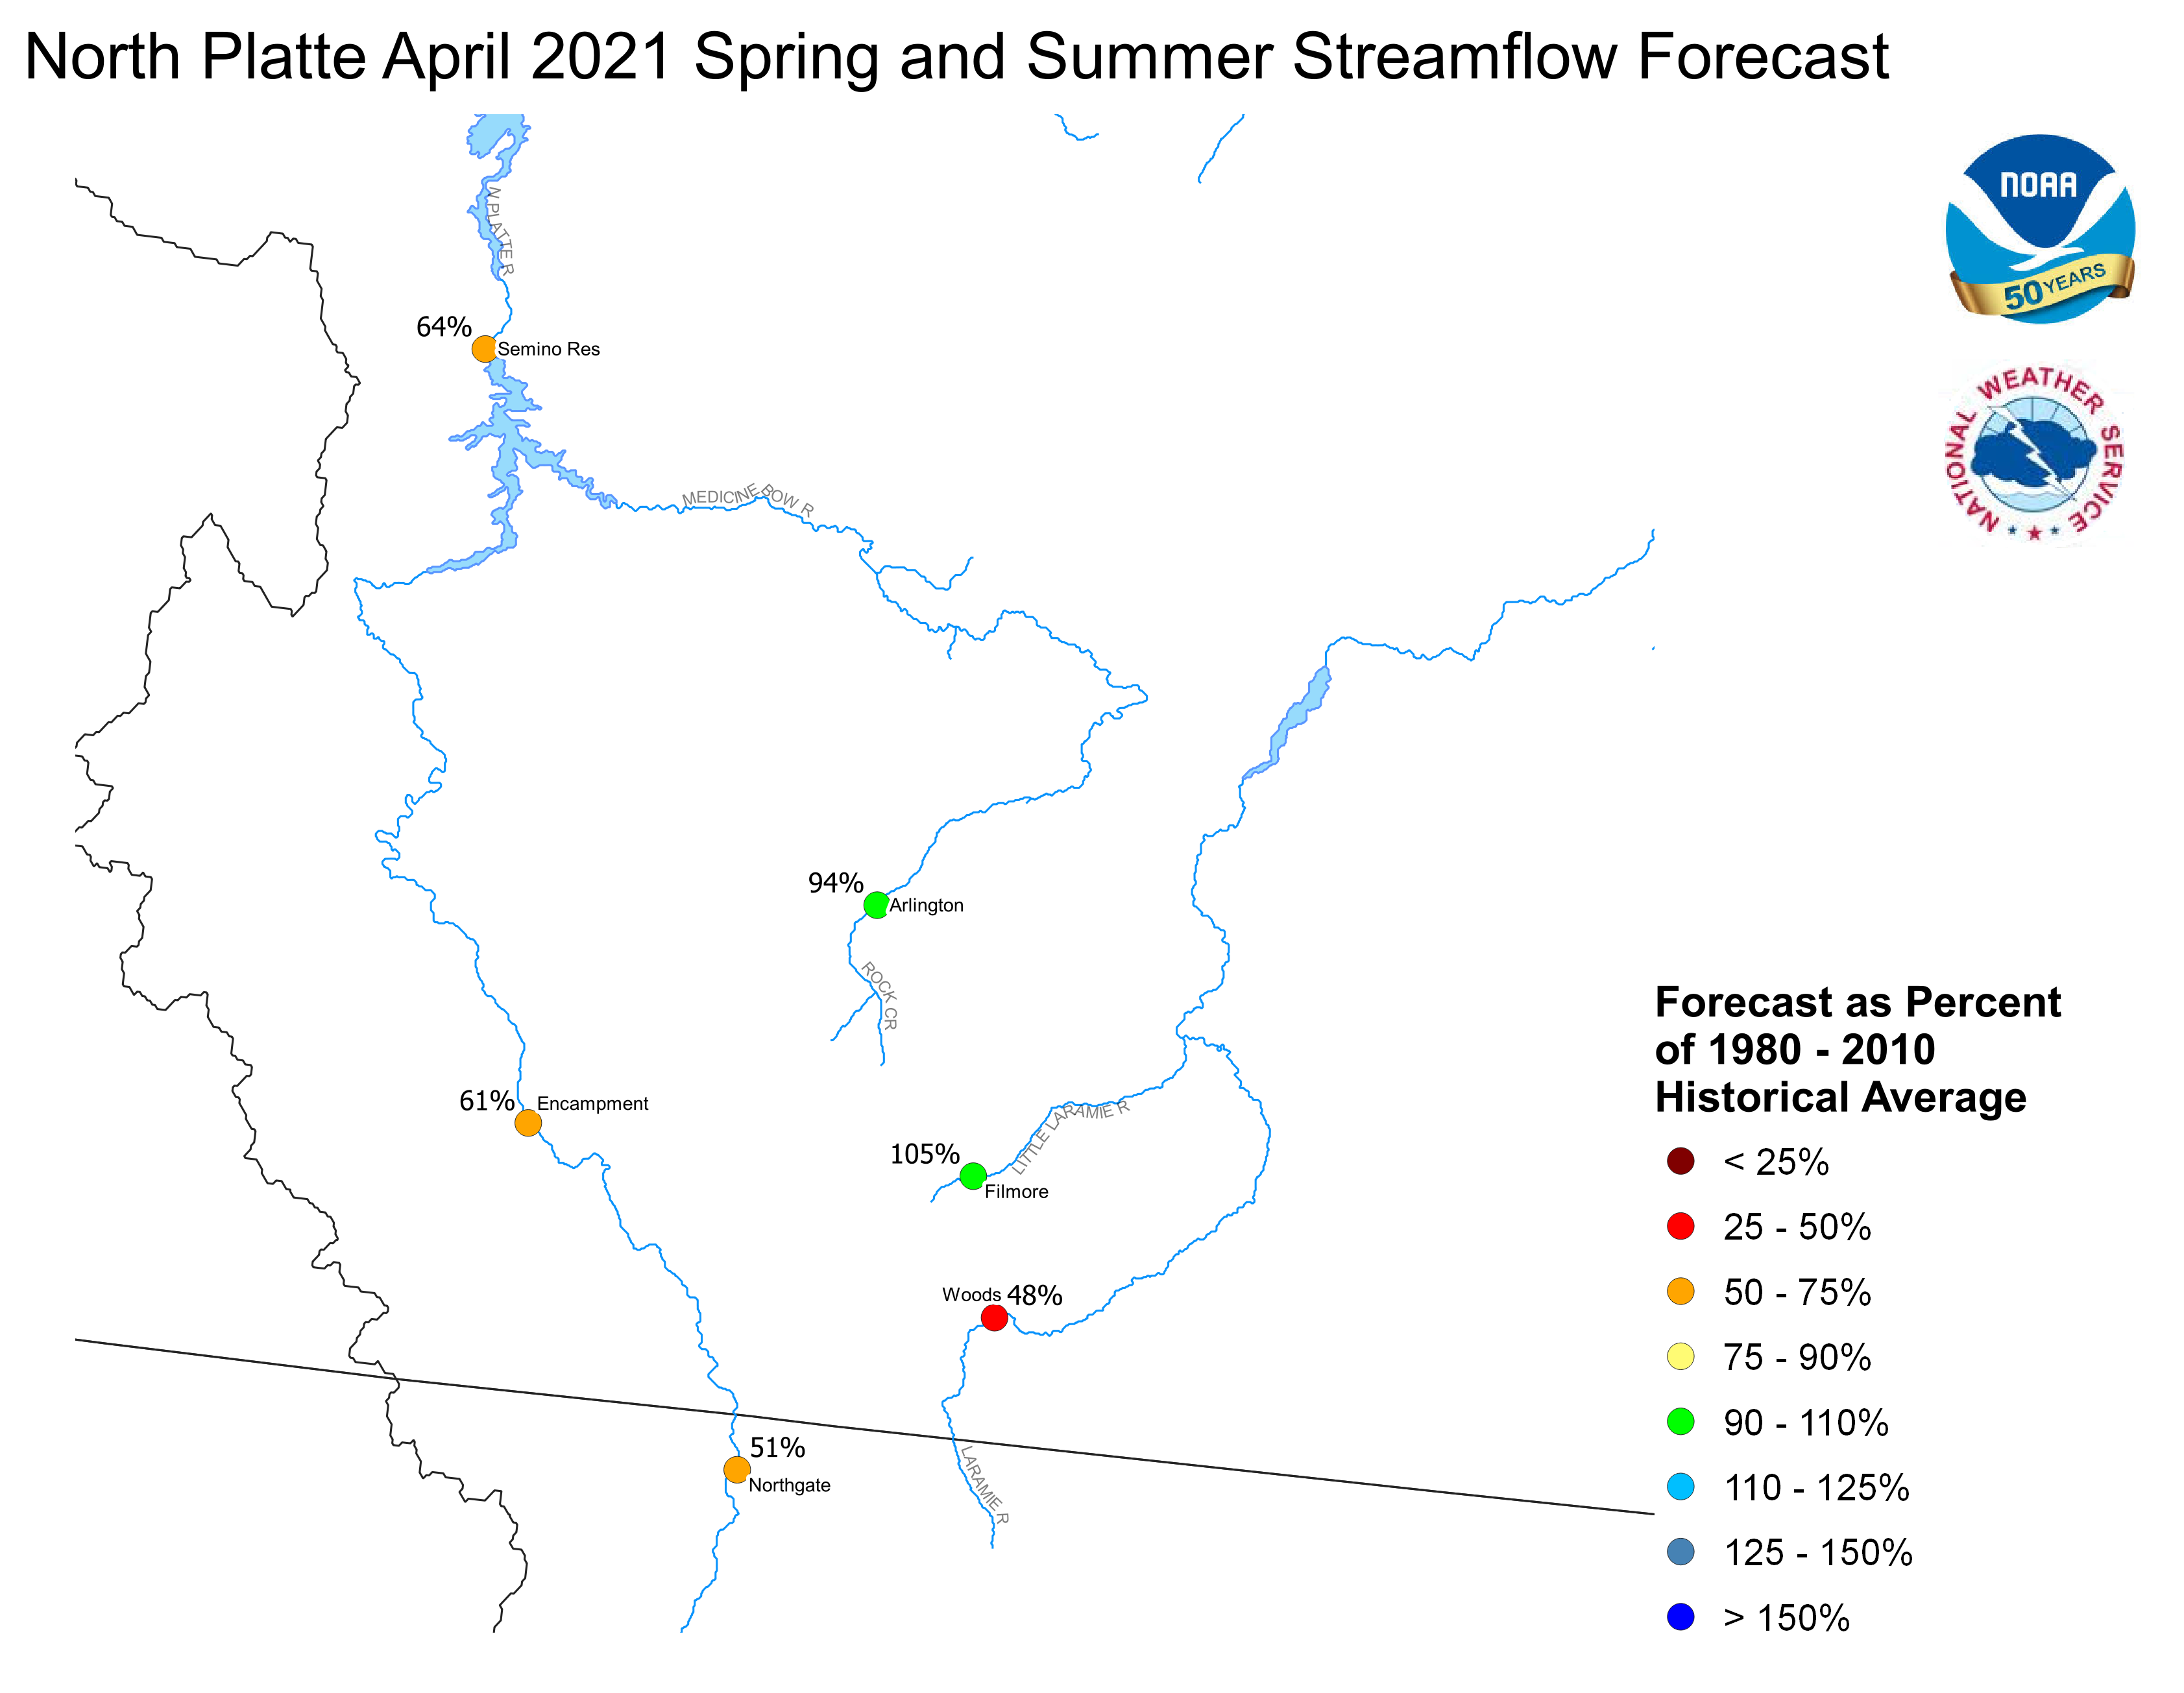
Stream flow in the Platte Basin is forecast to be below
average during the upcoming Spring and Summer. Runoff
for streams above Seminoe Reservoir are expected to be
about 73 percent of average. Streams in the South Platte
Basin above South Platte, Colorado can expect 68 percent
of average flow. For the remainder of the South Platte
basin, flows are expected near 68 percent.
Stored water in the South Platte Basin was 99 percent of average
on April 1.
North Platte Streamflow Fcst South Platte Streamflow Fcst
FGUS63 KKRF 021240
ESPKRF
WATER SUPPLY FORECAST
NWS MISSOURI BASIN RIVER FORECAST CENTER
PLEASANT HILL MISSOURI

0736 AM CDT FRIDAY APRIL 02, 2021

DATA CURRENT AS OF: APRIL 01, 2021

MISSOURI/YELLOWSTONE/PLATTE RIVER BASIN FORECASTS


                                          50%   %   10%   90%   AVG
FORECAST POINT                   PERIOD  (KAF) AVG (KAF) (KAF) (KAF)
--------------------------------------------------------------------

Boysen Resvr Inflow              Apr-Sep  593   52  1071  367   1140
 SBDW4N

Bighorn R at Kane                Apr-Sep 1072   63  1710  689   1690
 LVEW4N

Greybull R at Meeteetse          Apr-Sep  103   58   172   52    177
 MEEW4N

Buffalo Bill Resvr Inflow        Apr-Sep  460   60   619  340    765
 CDYW4N

St. Mary R nr Babb               Apr-Sep  393   74   462  332    535
 SMYM8N

St. Mary R at Intl Boundary      Apr-Sep  458   69   554  387    660
 SMBM8N

Milk R nr Western Crossing       Apr-Sep   20   49    51   10     41
 PDBM8N

Milk R nr Eastern Crossing       Apr-Sep   41   51   134   20     81
 ERNM8N

North Platte R nr Northgate      Apr-Sep  154   51   279  104    300
 NGTC2

Encampment R nr Encampment       Apr-Sep   88   59   125   64    150
 ECRW4

Encampment R nr Encampment       Apr-Sep   98   61   135   74    160
 ECRW4N

Rock Cr nr Arlington             Apr-Sep   49   95    59   39     52
 KCRW4

Rock Cr nr Arlington             Apr-Sep   50   94    59   39     53
 KCRW4N

Seminoe Resvr Inflow             Apr-Sep  453   56   696  311    805
 SETW4

Seminoe Resvr Inflow             Apr-Sep  611   64   852  463    955
 SETW4N

Laramie R nr Woods Landing       Apr-Sep   33   31    73   21    108
 WODW4

Laramie R nr Woods Landing       Apr-Sep   68   48   108   48    142
 WODW4N

Little Laramie R nr Filmore      Apr-Sep   58  105    74   46     55
 SMTW4

Little Laramie R nr Filmore      Apr-Sep   60  105    76   48     57
 SMTW4N

Antero Resvr Inflow              Apr-Sep   17   98    23   12     17
 ANRC2N

Spinney Mountain Resvr Inflow    Apr-Sep   38   67    49   27     56
 SPYC2N

Elevenmile Canyon Resvr Inflow   Apr-Sep   43   71    56   30     60
 EVNC2N

Cheesman Lk Inflow               Apr-Sep   74   65   117   52    114
 CHEC2N

S Platte R at S Platte           Apr-Sep  146   71   226  110    205
 SPTC2N

Bear Cr at Morrison              Apr-Sep   14   67    32    7     21
 MRRC2N

Clear Cr at Golden               Apr-Sep   63   54    96   45    117
 GLDC2N

St. Vrain Cr at Lyons            Apr-Sep   70   63   121   59    111
 LNSC2N

Boulder Cr nr Orodell            Apr-Sep   36   69    53   28     52
 OROC2N

S Boulder Cr nr Eldorado Sprgs   Apr-Sep   23   56    38   15     40
 BELC2N

Cache La Poudre at Canyon Mouth  Apr-Sep  153   73   238  105    210
 FTDC2N

Lima Resvr Inflow                Apr-Sep   24   30    47   17     78
 LRRM8N

Clark Canyon Resvr Inflow        Apr-Sep   59   37    99   41    159
 CLKM8N

Beaverhead R at Barretts         Apr-Sep   85   44   129   65    194
 BARM8N

Ruby R Resvr Inflow              Apr-Sep   59   60    74   46     97
 ALRM8N

Big Hole R nr Melrose            Apr-Sep  450   80   673  352    560
 MLRM8

Big Hole R nr Melrose            Apr-Sep  515   90   738  418    570
 MLRM8N

Hebgen Resvr Inflow              Apr-Sep  389   90   441  328    430
 HBDM8N

Ennis Resvr Inflow               Apr-Sep  676   91   794  579    745
 ELMM8N

Gallatin R nr Gateway            Apr-Sep  262   58   356  210    455
 GLGM8

Gallatin R nr Gateway            Apr-Sep  262   58   356  210    455
 GLGM8N

Gallatin R at Logan              Apr-Sep  224   44   376  170    505
 LOGM8

Gallatin R at Logan              Apr-Sep  363   61   499  294    595
 LOGM8N

Missouri R at Toston             Apr-Sep 1954   78  2632 1660   2510
 TOSM8N

Missouri R at Fort Benton        Apr-Sep 2972   81  4071 2636   3690
 FBNM8N

Missouri R nr Virgelle           Apr-Sep 3411   80  4703 2982   4280
 VRGM8N

Missouri R nr Landusky           Apr-Sep 3677   82  5003 3208   4490
 LDKM8N

Missouri R below Fort Peck Dam   Apr-Sep 3798   80  5185 3299   4730
 FPKM8N

Gibson Resvr Inflow              Apr-Sep  456  114   647  396    400
 AGSM8N

Marias R nr Shelby               Apr-Sep  363   81   527  285    450
 SHLM8N

Musselshell R at Harlowton       Apr-Sep   54   52   102   37    104
 HLWM8N

Yellowstone R at Yellowstone Lk  Apr-Sep  471   59   574  378    795
 YLOW4

Yellowstone R at Yellowstone Lk  Apr-Sep  652   78   777  527    840
 YLOW4N

Yellowstone R at Corwin Sprgs    Apr-Sep 1305   69  1627 1102   1880
 CORM8

Yellowstone R at Corwin Sprgs    Apr-Sep 1562   79  1918 1330   1980
 CORM8N

Yellowstone R at Livingston      Apr-Sep 1602   75  2005 1362   2130
 LIVM8

Yellowstone R at Livingston      Apr-Sep 1921   83  2361 1643   2310
 LIVM8N

Yellowstone R at Billings        Apr-Sep 2435   65  3353 1984   3730
 BILM8

Yellowstone R at Billings        Apr-Sep 3394   80  4309 2886   4260
 BILM8N

Yellowstone R at Miles City      Apr-Sep 5157   71  6773 4172   7250
 MILM8N

Yellowstone R at Sidney          Apr-Sep 5314   70  7041 4295   7540
 SIDM8N

Boulder R at Big Timber          Apr-Sep  178   59   248  149    300
 BTMM8

Boulder R at Big Timber          Apr-Sep  218   67   288  190    325
 BTMM8N

Stillwater R nr Absarokee        Apr-Sep  301   60   404  240    505
 SRAM8

Stillwater R nr Absarokee        Apr-Sep  355   65   458  297    550
 SRAM8N

Clks Fk Yellowstone R nr Belfry  Apr-Sep  403   73   536  319    550
 BFYM8

Clks Fk Yellowstone R nr Belfry  Apr-Sep  475   79   609  392    600
 BFYM8N

Bighorn R nr St. Xavier          Apr-Sep 1565   61  2432 1090   2550
 STXM8N

Little Bighorn R nr Hardin       Apr-Sep   52   51    82   37    103
 HRDM8N

Tongue R nr Dayton               Apr-Sep   63   75    80   46     83
 DAYW4N

Tongue R nr Decker               Apr-Sep  141   65   214  101    215
 DSLM8N

Tongue R Resvr Inflow            Apr-Sep  141   66   216  101    215
 DKRM8N

Powder R at Moorhead             Apr-Sep  142   65   284   93    220
 MHDM8N

Powder R nr Locate               Apr-Sep  152   62   318   99    245
 LOCM8N


Locations with an `N` suffix indicate natural flows excluding
stream augmentations.

KAF: Thousands of Acre-feet

%AVG: Current 50%/AVG

AVG: Average(50%) seasonal runoff voulme as simulated by the river
forecast model considering acontinuous simulation of the basin
response to historic climate data (observed precipitation and
temperatures) over the period of 1981-2010.

The 50%, 10% and 90% columns indicate the probability that the
actual volume will exceed the forecast for the valid time perion
for more information, please visit: www.weather.gov/mbrfc/water


