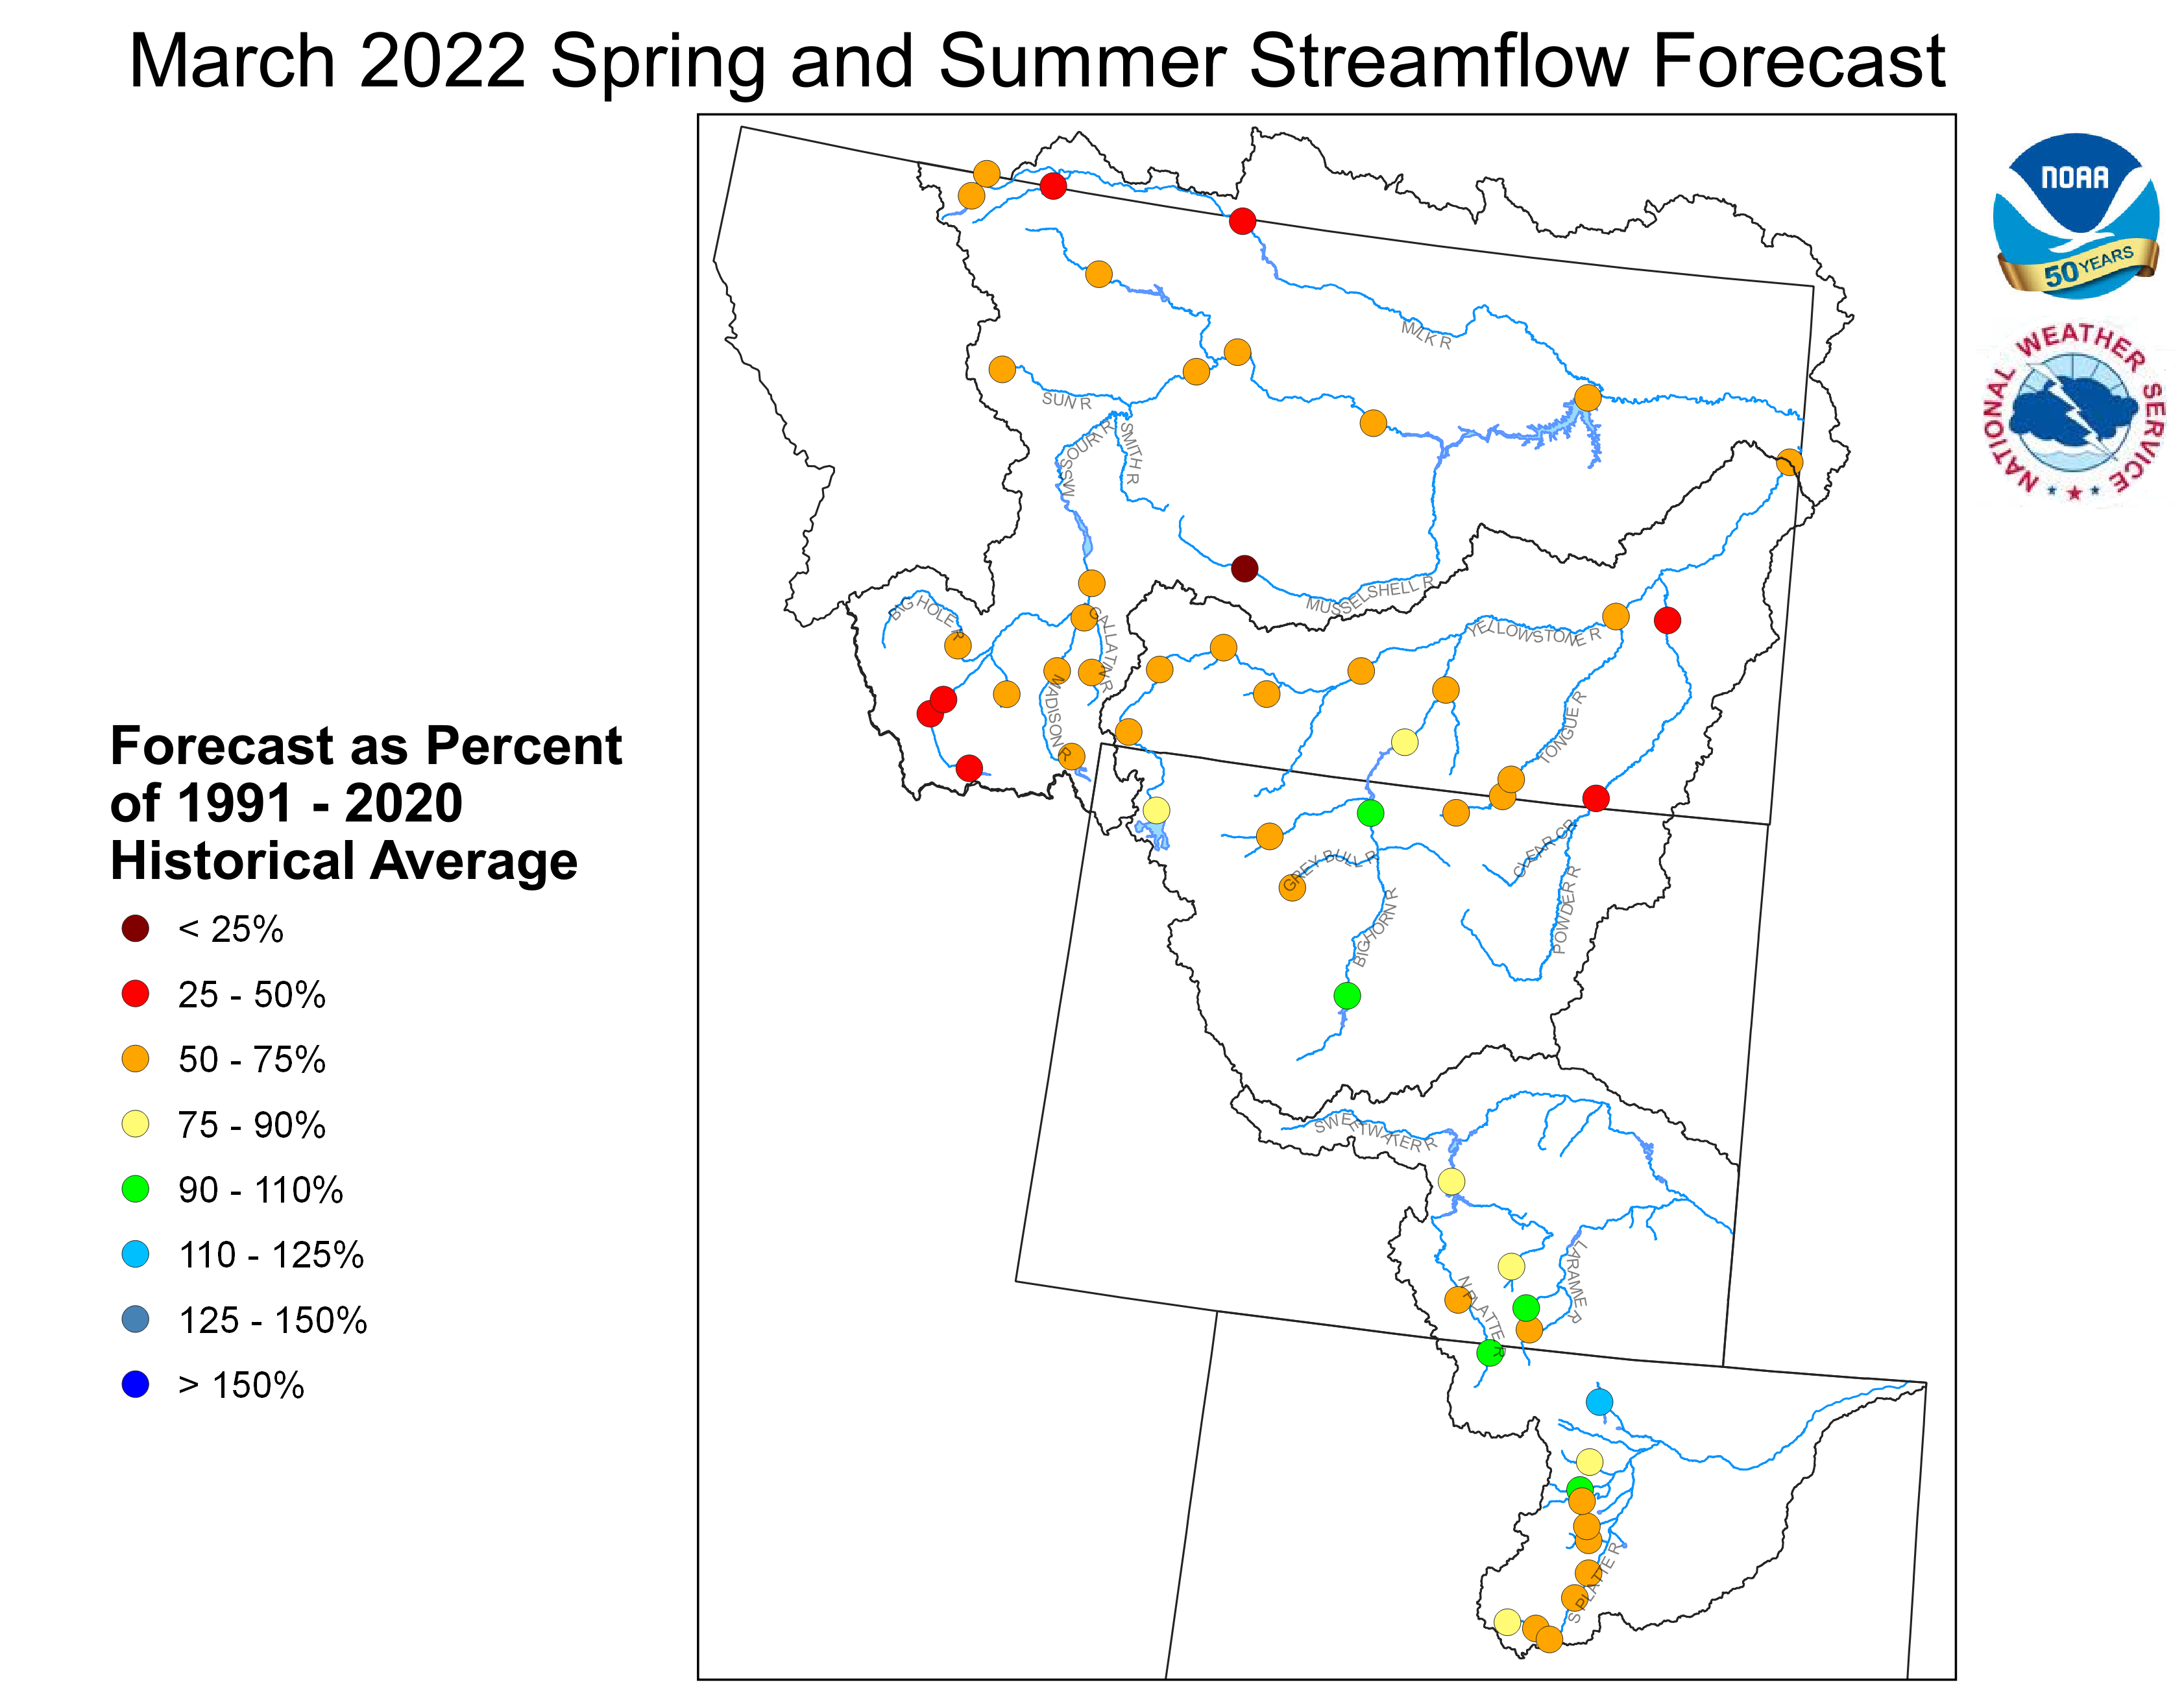
March 1, 2022 Spring and Summer Streamflow Forecasts
Upper Missouri Basin
The high elevation snow pack in the Upper Missouri Basin as of March 1
was near to above average. The snow pack in the St. Mary Basin was 107 percent,
and the Milk River Basin was 79 percent.
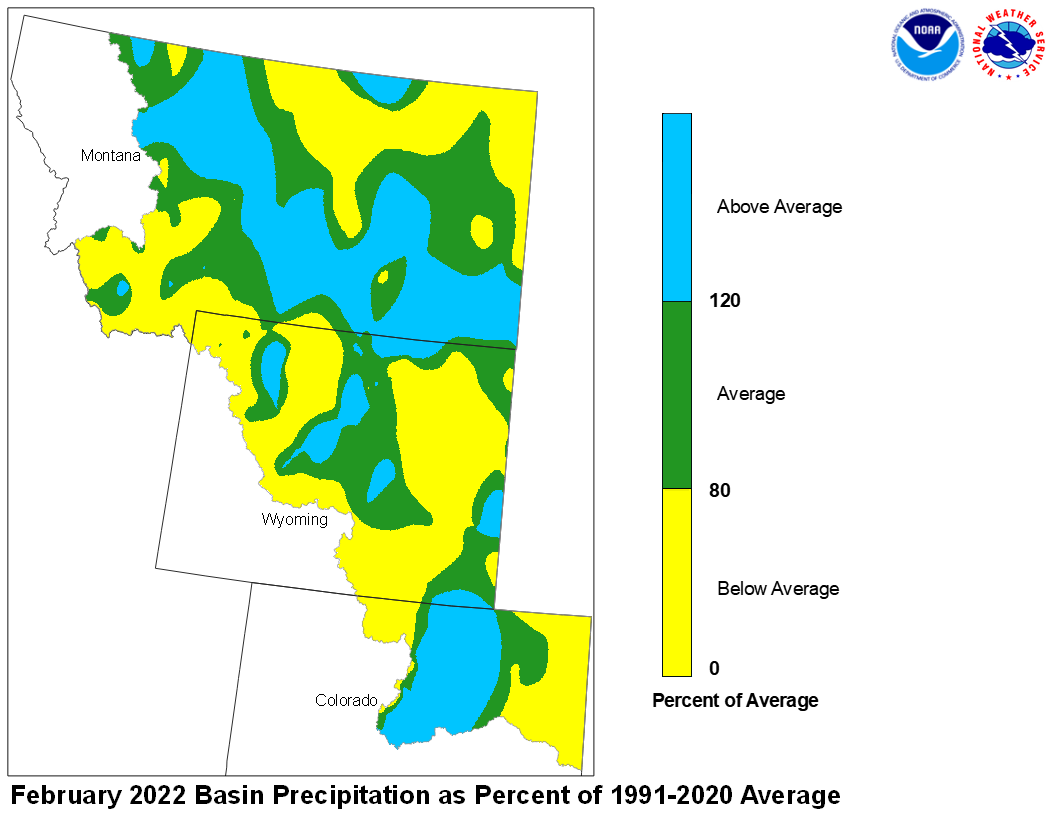
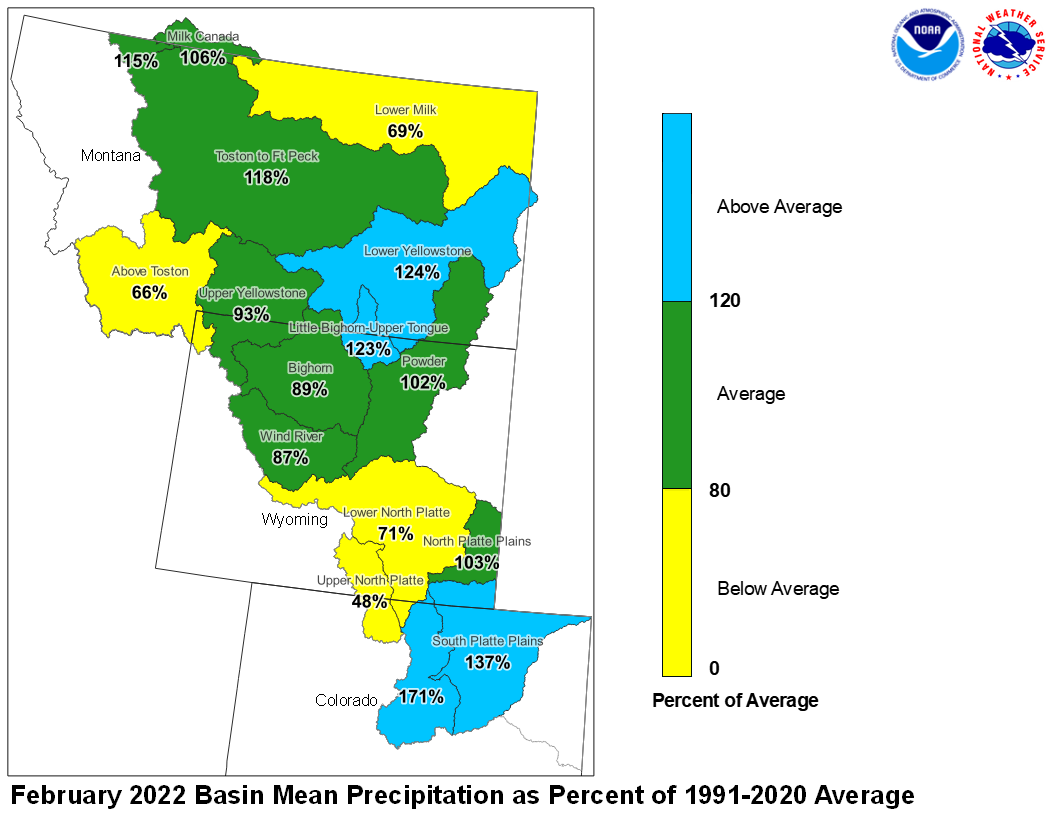
February precipitation across the Upper Missouri Basin ranged from above to below
average. Basin precipitation summaries for the Missouri Basin include: Milk St. Mary,
115 percent; Milk Canada, 106 percent; Lower Milk, 69 percent; above Toston,
66 percent; Toston to Ft. Peck, 118 percent.
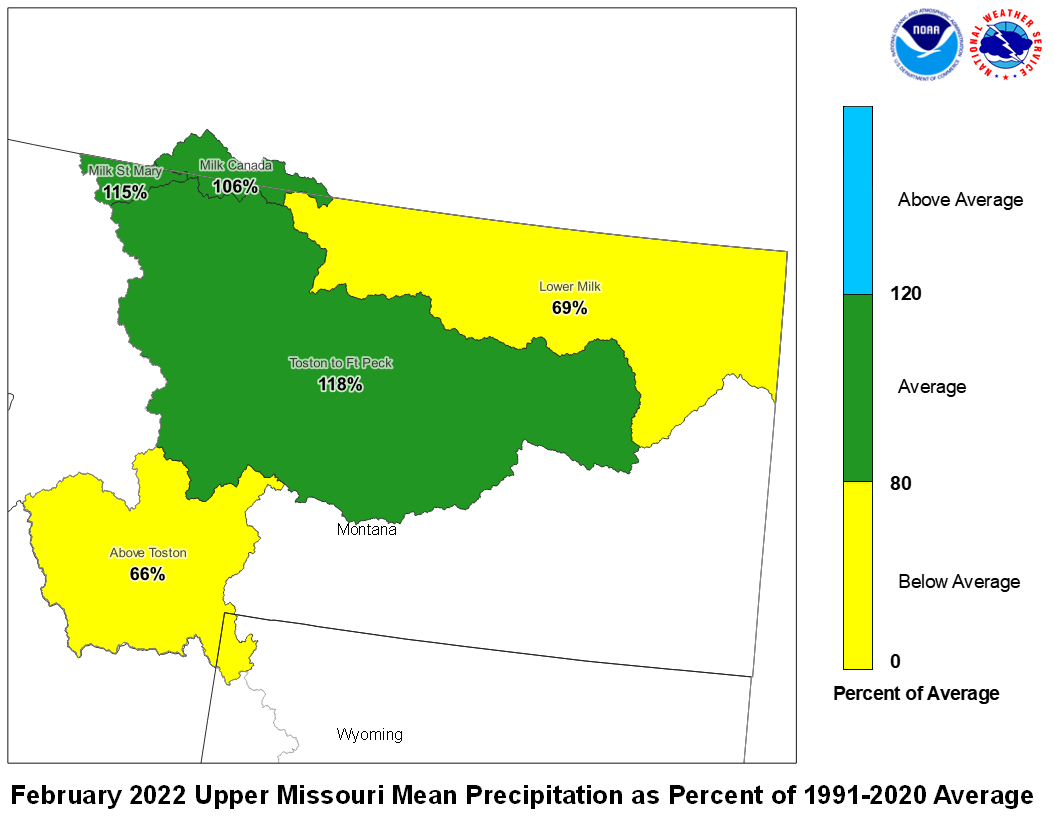
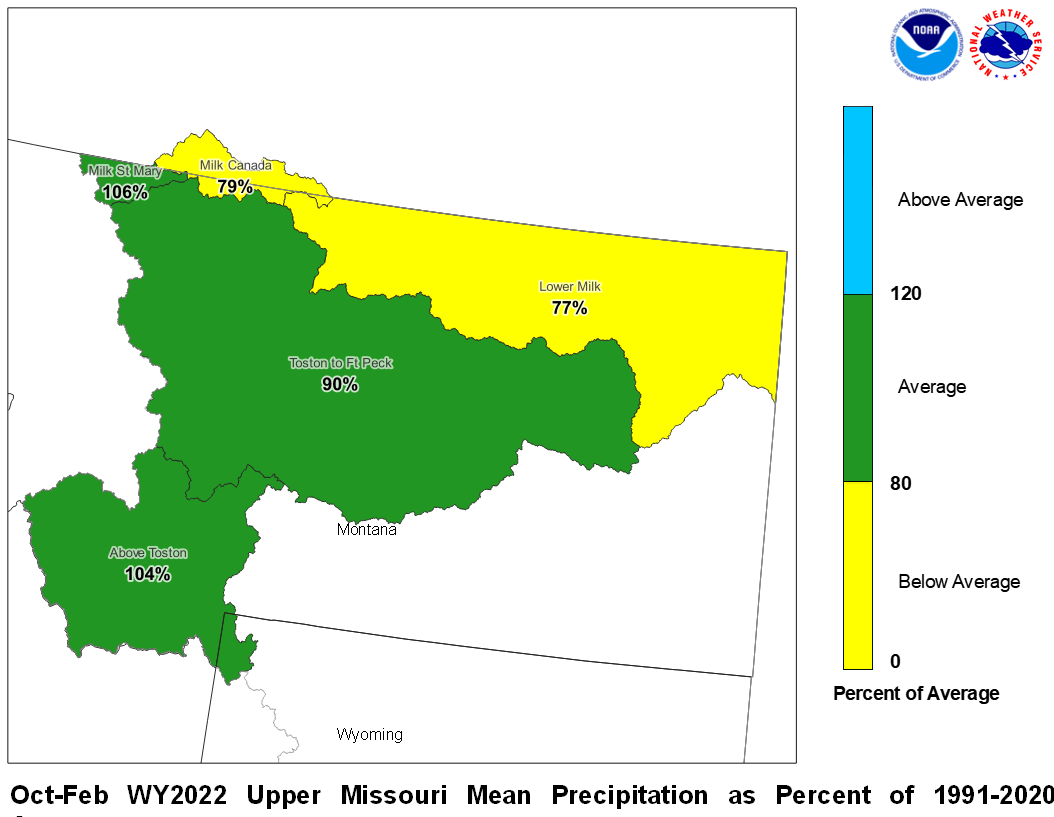
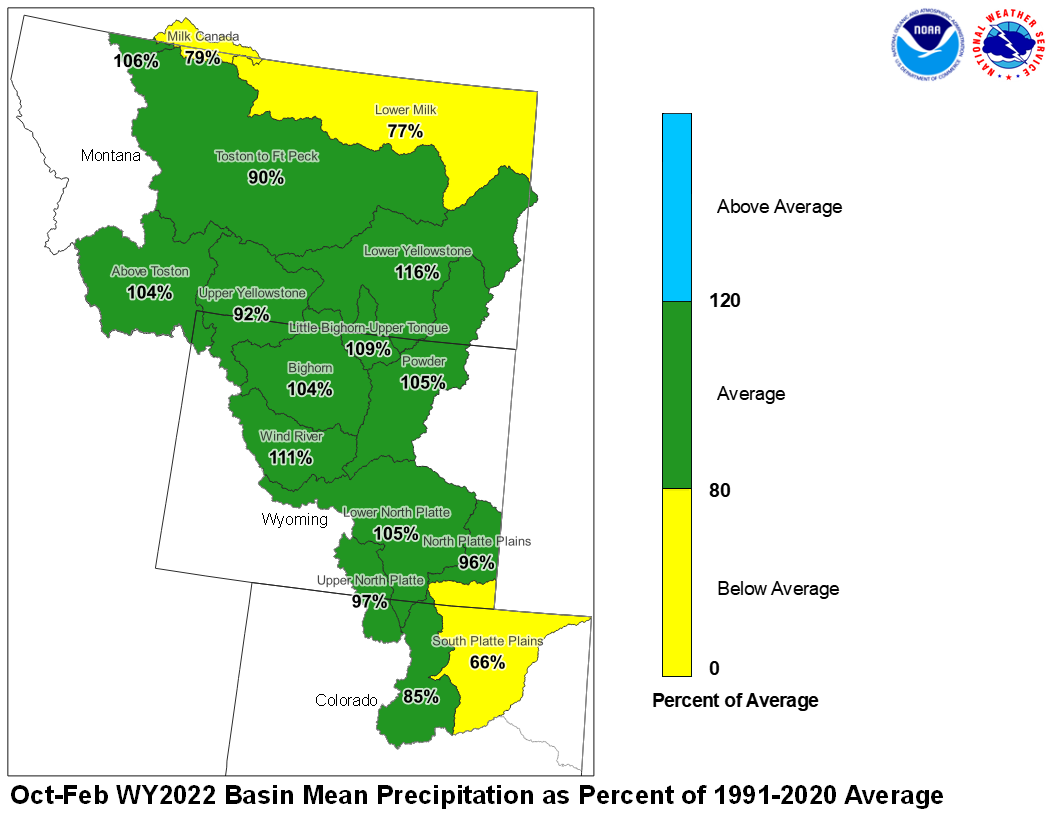
February 2022 Upper Missouri Mean Precip Oct-Feb WY2022 Upper Missouri Mean Precip
Stream flow in the Upper Missouri Basin is forecast to be
below average during the upcoming Spring and Summer.
The St. Mary River is forecast to have 67 percent of average
April-September flows. Runoff is expected to range around
65 percent of average for the Missouri Basin above Fort Peck,
Montana.

Upper Missouri March 1, 2022 Spring and Summer Streamflow Forecasts
Of the four major irrigation reservoirs in Montana; Lima
Reservoir had 69 percent average storage, Clark Canyon was
holding 74 percent of average water, Gibson Reservoir had 49
percent of average stored water, and Fresno Reservoir had
62 percent of average stored water.
Yellowstone Basin
The high elevation snow pack in the Yellowstone Basin was near to below average
on March 1. The snow pack in the Upper Yellowstone Basin was 80 percent
of average. The snow packs in the Wind, Bighorn, and Shoshone Basins were 92,
87, and 83 percent of average, respectively. The snow packs in the Tongue
and Powder basins were 93 and 83 percent of average, respectively.
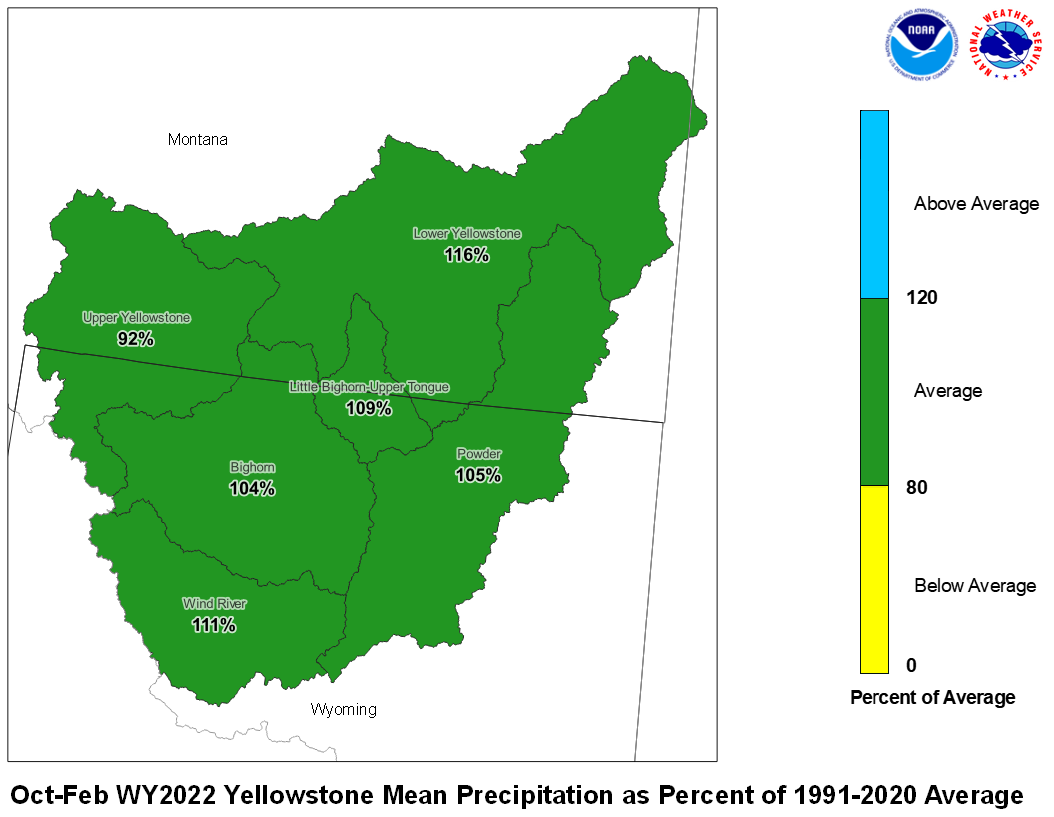
Precipitation during February ranged from above to below average. The
upper Yellowstone River Basin received 93 percent of average precipitation
while the Lower Yellowstone River Basin reported 124 percent of average. The
Bighorn Basin received 89 percent of average precipitation while the
Wind River Basin received 87 percent of average. The Little Bighorn -
Upper Tongue Basin received 123 percent of average and the Powder River
had 102 percent of average precipitation.
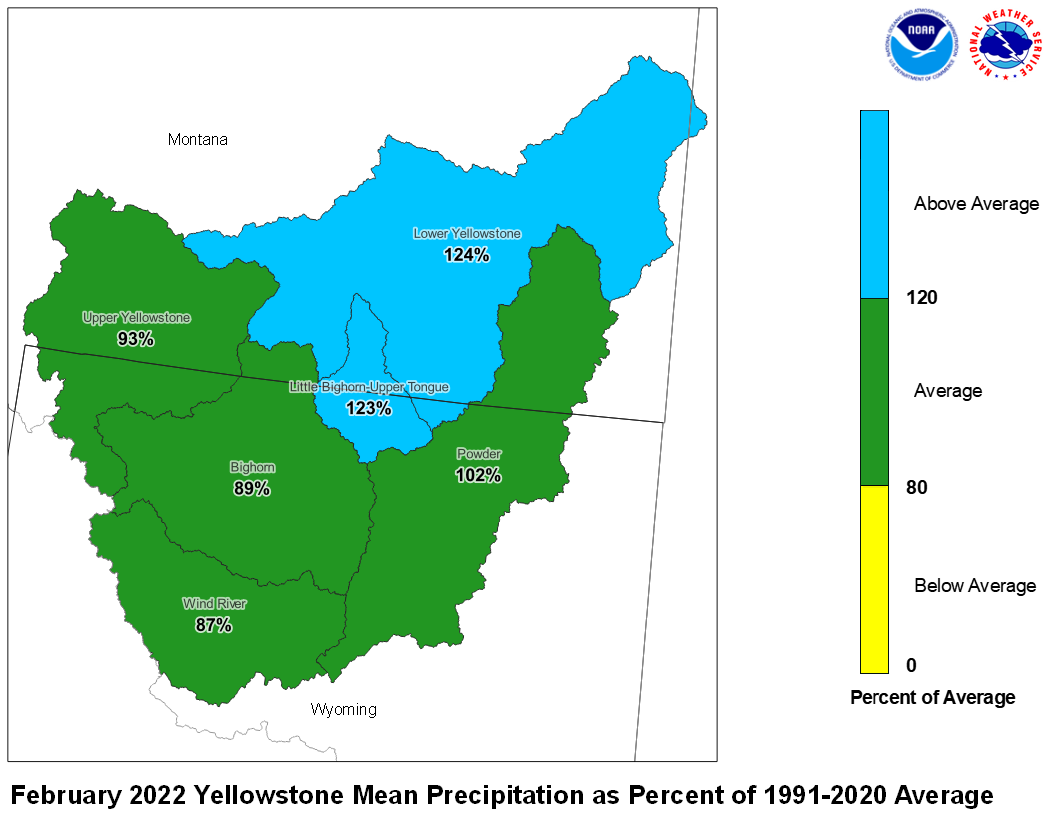
February 2022 Yellowstone Mean Precip Oct-Feb WY2022 Yellowstone Mean Precip
Forecast stream flow in the Yellowstone Basin is below average
for the upcoming Spring and Summer. Stream flow for the
Yellowstone River above Sidney, Montana is forecast to be about
68 percent of average. Flow in the Tongue Basin is expected to be
60 percent of average. Flows in the Powder River are expected
to be about 47 percent of average.
Monthend storage at Boysen Reservoir was 106 percent of average.
Stored water in Buffalo Bill Reservoir was 87 percent of average.
Monthend storage was 96 percent of average at Bighorn Reservoir.

Yellowstone March 1, 2022 Spring and Summer Streamflow Forecasts
Platte Basin
The high elevation snow pack in the Upper North Platte Basin was
91 percent of average on March 1. The snow pack in the North Platte
Basin below Seminoe Reservoir was 97 percent of average. The snow
pack in the South Platte Basin was 101 percent of average.
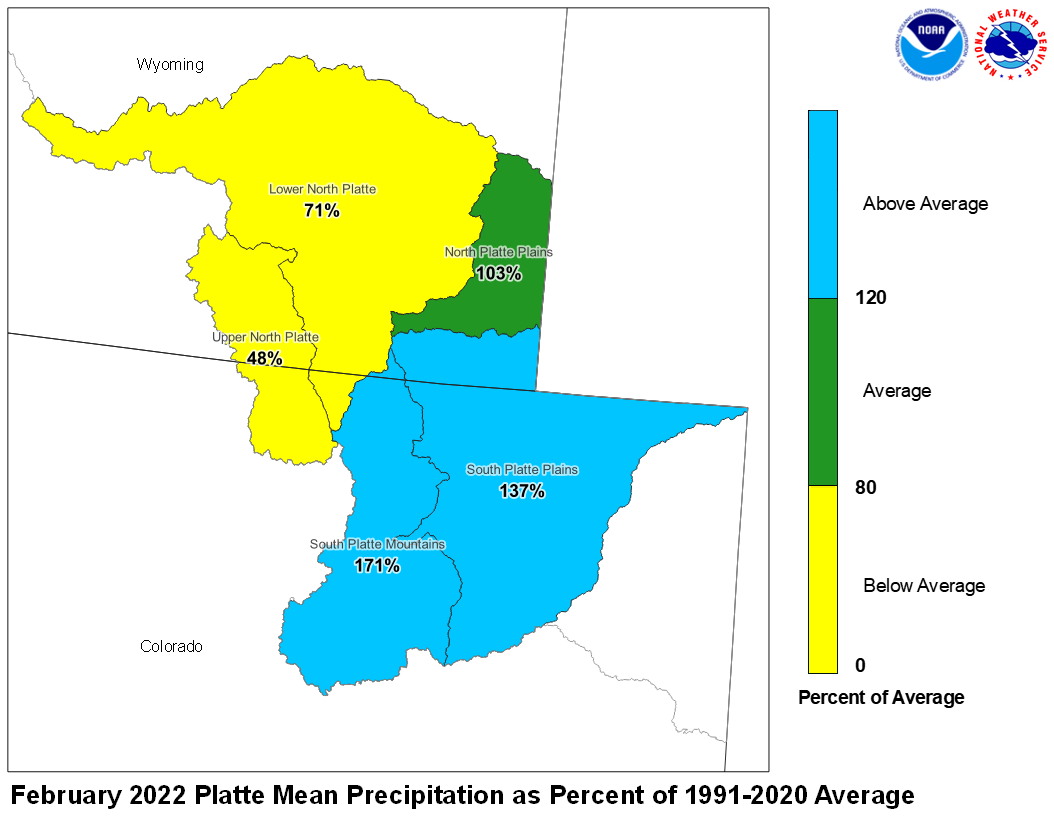
Precipitation during February in the Upper North Platte Basin was 48
percent of average. In the Lower North Platte Basin, precipitation
was 71 percent of average. The North Platte Plains below Guernsy
Reservoir had 103 percent. The South Platte Mountains had 171
percent whereas the Plains had 137 percent of average February
precipitation.

February 2022 Platte Mean Precip Oct-Feb WY2022 Platte Mean Precip
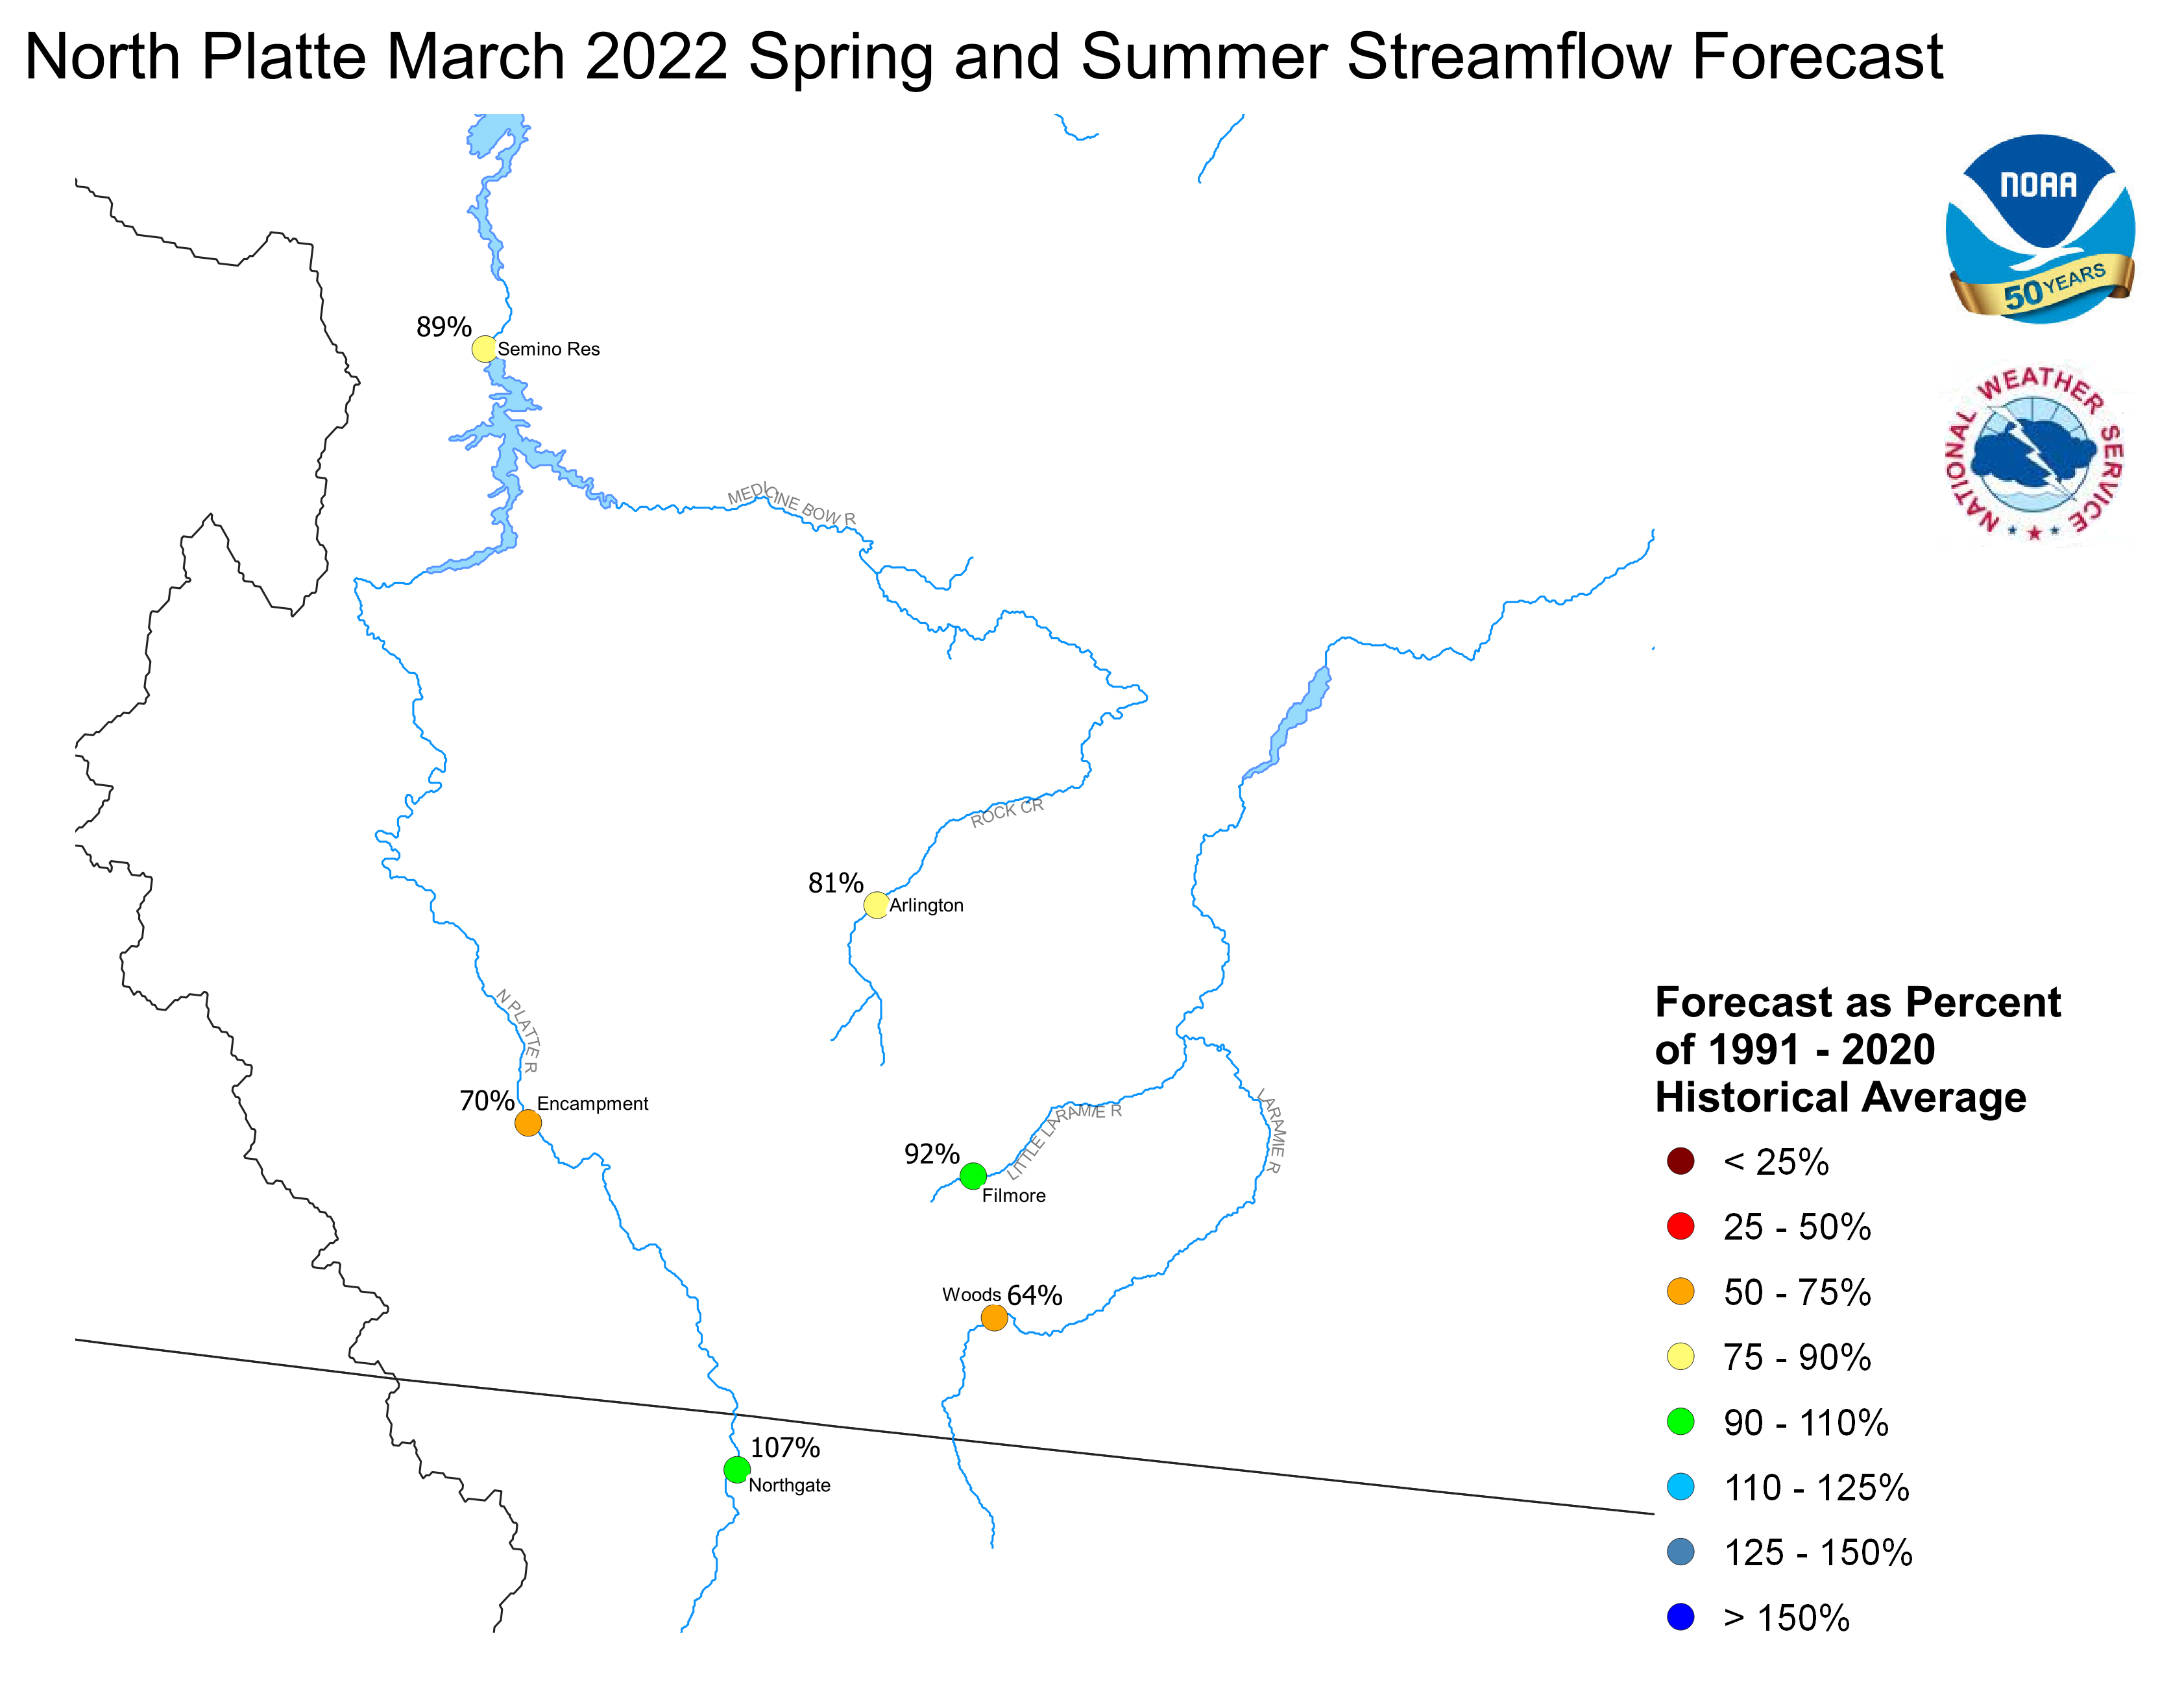
Stream flow in the Platte Basin is forecast to be below
average during the upcoming Spring and Summer. Runoff
for streams above Seminoe Reservoir are expected to be
about 98 percent of average. Streams in the South Platte
Basin above South Platte, Colorado can expect 80 percent
of average flow. For the remainder of the South Platte
basin, flows are expected near 84 percent.
Stored water in the South Platte Basin was 101 percent of average
on March 1.
North Platte Streamflow Fcst South Platte Streamflow Fcst
FGUS63 KKRF 021430
ESPKRF
WATER SUPPLY FORECAST
NWS MISSOURI BASIN RIVER FORECAST CENTER
PLEASANT HILL MISSOURI

0754 CST WEDNESDAY MARCH 02, 2022

DATA CURRENT AS OF: MARCH 01, 2022

MISSOURI/YELLOWSTONE/PLATTE RIVER BASIN FORECASTS


                                          50%   %   10%   90%   AVG
FORECAST POINT                   PERIOD  (KAF) AVG (KAF) (KAF) (KAF)
--------------------------------------------------------------------

Boysen Resvr Inflow              Apr-Sep  530   74  1051  214    720
 SBDW4

Boysen Resvr Inflow              Apr-Sep  969  109  1585  581    890
 SBDW4N

Bighorn R at Kane                Apr-Sep  872   89  1575  561    985
 LVEW4

Bighorn R at Kane                Apr-Sep 1554  108  2382  889   1440
 LVEW4N

Greybull R at Meeteetse          Apr-Sep  142   72   222   63    196
 MEEW4

Greybull R at Meeteetse          Apr-Sep  142   69   222   63    205
 MEEW4N

Buffalo Bill Resvr Inflow        Apr-Sep  393   48   555  260    815
 CDYW4

Buffalo Bill Resvr Inflow        Apr-Sep  462   51   634  332    910
 CDYW4N

St. Mary R nr Babb               Apr-Sep  380   83   437  338    460
 SMYM8

St. Mary R nr Babb               Apr-Sep  357   67   415  314    535
 SMYM8N

St. Mary R at Intl Boundary      Apr-Sep  300   77   389  248    390
 SMBM8

St. Mary R at Intl Boundary      Apr-Sep  414   63   490  366    660
 SMBM8N

Milk R nr Western Crossing       Apr-Sep   12   11    29    7    113
 PDBM8

Milk R nr Western Crossing       Apr-Sep   19   45    42   10     41
 PDBM8N

Milk R nr Eastern Crossing       Apr-Sep  146   68   208  135    215
 ERNM8

Milk R nr Eastern Crossing       Apr-Sep   35   31   132   18    112
 ERNM8N

North Platte R nr Northgate      Apr-Sep  263  107   423  158    245
 NGTC2

North Platte R nr Northgate      Apr-Sep  317  107   476  207    295
 NGTC2N

Encampment R nr Encampment       Apr-Sep  105   67   169   74    156
 ECRW4

Encampment R nr Encampment       Apr-Sep  116   70   179   87    166
 ECRW4N

Rock Cr nr Arlington             Apr-Sep   43   81    57   33     53
 KCRW4

Rock Cr nr Arlington             Apr-Sep   43   81    57   33     53
 KCRW4N

Seminoe Resvr Inflow             Apr-Sep  655   86  1040  450    765
 SETW4

Seminoe Resvr Inflow             Apr-Sep  817   89  1200  615    920
 SETW4N

Laramie R nr Woods Landing       Apr-Sep   55   51   104   25    108
 WODW4

Laramie R nr Woods Landing       Apr-Sep   91   64   140   56    142
 WODW4N

Little Laramie R nr Filmore      Apr-Sep   50   91    75   35     55
 SMTW4

Little Laramie R nr Filmore      Apr-Sep   52   92    77   37     57
 SMTW4N

Antero Resvr Inflow              Apr-Sep   11   75    18    5     14
 ANRC2

Antero Resvr Inflow              Apr-Sep   11   75    18    5     14
 ANRC2N

Spinney Mountain Resvr Inflow    Apr-Sep   39   68    60   28     57
 SPYC2

Spinney Mountain Resvr Inflow    Apr-Sep   29   66    53   17     45
 SPYC2N

Elevenmile Canyon Resvr Inflow   Apr-Sep   37   63    47   31     59
 EVNC2

Elevenmile Canyon Resvr Inflow   Apr-Sep   33   66    57   18     50
 EVNC2N

Cheesman Lk Inflow               Apr-Sep   65   65   101   48    100
 CHEC2

Cheesman Lk Inflow               Apr-Sep   67   72   114   36     93
 CHEC2N

S Platte R at S Platte           Apr-Sep  314  131   393  291    240
 SPTC2

S Platte R at S Platte           Apr-Sep  136   66   224   73    205
 SPTC2N

Bear Cr at Morrison              Apr-Sep   13   50    30    6     26
 MRRC2

Bear Cr at Morrison              Apr-Sep   13   50    30    6     26
 MRRC2N

Clear Cr at Golden               Apr-Sep   71   61   111   48    118
 GLDC2

Clear Cr at Golden               Apr-Sep   82   63   124   56    131
 GLDC2N

St. Vrain Cr at Lyons            Apr-Sep   65   83    95   46     79
 LNSC2

St. Vrain Cr at Lyons            Apr-Sep   92   85   146   67    109
 LNSC2N

Boulder Cr nr Orodell            Apr-Sep   37   78    57   25     47
 OROC2

Boulder Cr nr Orodell            Apr-Sep   52  101    74   39     52
 OROC2N

S Boulder Cr nr Eldorado Sprgs   Apr-Sep   29   83    40   18     35
 BELC2

S Boulder Cr nr Eldorado Sprgs   Apr-Sep   30   74    49   18     40
 BELC2N

Cache La Poudre at Canyon Mouth  Apr-Sep  197  183   299  113    108
 FTDC2

Cache La Poudre at Canyon Mouth  Apr-Sep  231  110   341  138    210
 FTDC2N

Lima Resvr Inflow                Apr-Sep   25   33    43   16     76
 LRRM8

Lima Resvr Inflow                Apr-Sep   25   32    43   16     79
 LRRM8N

Clark Canyon Resvr Inflow        Apr-Sep   34   31    46   26    110
 CLKM8

Clark Canyon Resvr Inflow        Apr-Sep   62   31   101   41    198
 CLKM8N

Beaverhead R at Barretts         Apr-Sep  111   56   126  103    199
 BARM8

Beaverhead R at Barretts         Apr-Sep   86   31   130   65    280
 BARM8N

Ruby R Resvr Inflow              Apr-Sep   60   68    77   47     88
 ALRM8

Ruby R Resvr Inflow              Apr-Sep   60   62    77   47     97
 ALRM8N

Big Hole R nr Melrose            Apr-Sep  398   67   647  294    595
 MLRM8

Big Hole R nr Melrose            Apr-Sep  463   70   714  356    660
 MLRM8N

Hebgen Resvr Inflow              Apr-Sep  298   64   350  245    465
 HBDM8

Hebgen Resvr Inflow              Apr-Sep  298   64   350  245    465
 HBDM8N

Ennis Resvr Inflow               Apr-Sep  438   61   512  369    715
 ELMM8

Ennis Resvr Inflow               Apr-Sep  464   64   545  376    730
 ELMM8N

Gallatin R nr Gateway            Apr-Sep  250   53   319  217    475
 GLGM8

Gallatin R nr Gateway            Apr-Sep  250   53   319  217    475
 GLGM8N

Gallatin R at Logan              Apr-Sep  240   48   348  172    505
 LOGM8

Gallatin R at Logan              Apr-Sep  365   56   481  301    650
 LOGM8N

Missouri R at Toston             Apr-Sep 1072   52  1657  781   2060
 TOSM8

Missouri R at Toston             Apr-Sep 1691   60  2244 1328   2830
 TOSM8N

Missouri R at Fort Benton        Apr-Sep 1716   56  1885 1585   3060
 FBNM8

Missouri R at Fort Benton        Apr-Sep 2571   63  3267 2022   4100
 FBNM8N

Missouri R nr Virgelle           Apr-Sep 1855   54  2133 1689   3420
 VRGM8

Missouri R nr Virgelle           Apr-Sep 3085   68  3819 2371   4560
 VRGM8N

Missouri R nr Landusky           Apr-Sep 1939   53  2275 1733   3680
 LDKM8

Missouri R nr Landusky           Apr-Sep 3238   66  3997 2464   4890
 LDKM8N

Missouri R below Fort Peck Dam   Apr-Sep 2004   52  2365 1746   3840
 FPKM8

Missouri R below Fort Peck Dam   Apr-Sep 3294   64  4229 2498   5180
 FPKM8N

Gibson Resvr Inflow              Apr-Sep  315   70   450  231    450
 AGSM8

Gibson Resvr Inflow              Apr-Sep  315   70   450  231    450
 AGSM8N

Marias R nr Shelby               Apr-Sep  295   68   494  214    435
 SHLM8

Marias R nr Shelby               Apr-Sep  354   72   551  264    490
 SHLM8N

Musselshell R at Harlowton       Apr-Sep   15   19    30   13     80
 HLWM8

Musselshell R at Harlowton       Apr-Sep   21   22    37   18     95
 HLWM8N

Yellowstone R at Yellowstone Lk  Apr-Sep  539   66   682  431    815
 YLOW4

Yellowstone R at Yellowstone Lk  Apr-Sep  709   84   879  578    840
 YLOW4N

Yellowstone R at Corwin Sprgs    Apr-Sep 1244   63  1514 1011   1980
 CORM8

Yellowstone R at Corwin Sprgs    Apr-Sep 1503   73  1800 1220   2070
 CORM8N

Yellowstone R at Livingston      Apr-Sep 1389   61  1736 1147   2290
 LIVM8

Yellowstone R at Livingston      Apr-Sep 1736   71  2081 1422   2440
 LIVM8N

Yellowstone R at Billings        Apr-Sep 1926   47  2569 1438   4070
 BILM8

Yellowstone R at Billings        Apr-Sep 2910   61  3544 2348   4790
 BILM8N

Yellowstone R at Miles City      Apr-Sep 3056   52  4039 2506   5850
 MILM8

Yellowstone R at Miles City      Apr-Sep 5220   68  6598 4343   7690
 MILM8N

Yellowstone R at Sidney          Apr-Sep 2934   51  4023 2300   5710
 SIDM8

Yellowstone R at Sidney          Apr-Sep 5394   67  6913 4414   8060
 SIDM8N

Boulder R at Big Timber          Apr-Sep  159   48   219  115    335
 BTMM8

Boulder R at Big Timber          Apr-Sep  202   54   260  156    375
 BTMM8N

Stillwater R nr Absarokee        Apr-Sep  310   57   399  246    540
 SRAM8

Stillwater R nr Absarokee        Apr-Sep  368   62   450  304    595
 SRAM8N

Clks Fk Yellowstone R nr Belfry  Apr-Sep  335   54   425  244    620
 BFYM8

Clks Fk Yellowstone R nr Belfry  Apr-Sep  408   59   495  317    695
 BFYM8N

Bighorn R nr St. Xavier          Apr-Sep  992   69  1583  773   1430
 STXM8

Bighorn R nr St. Xavier          Apr-Sep 2132   87  3054 1380   2460
 STXM8N

Little Bighorn R nr Hardin       Apr-Sep   77   61   147   45    127
 HRDM8

Little Bighorn R nr Hardin       Apr-Sep   77   61   147   45    127
 HRDM8N

Tongue R nr Dayton               Apr-Sep   58   61    75   38     96
 DAYW4

Tongue R nr Dayton               Apr-Sep   64   63    81   43    101
 DAYW4N

Tongue R nr Decker               Apr-Sep   96   41   154   45    235
 DSLM8

Tongue R nr Decker               Apr-Sep  142   59   201   84    240
 DSLM8N

Tongue R Resvr Inflow            Apr-Sep   97   41   162   45    235
 DKRM8

Tongue R Resvr Inflow            Apr-Sep  144   59   209   84    245
 DKRM8N

Powder R at Moorhead             Apr-Sep   93   41   211   36    225
 MHDM8

Powder R at Moorhead             Apr-Sep  129   48   267   63    270
 MHDM8N

Powder R nr Locate               Apr-Sep   99   38   265   40    260
 LOCM8

Powder R nr Locate               Apr-Sep  134   44   306   66    305
 LOCM8N


Locations with an `N` suffix indicate natural flows excluding
stream augmentations.

KAF: Thousands of Acre-feet

%AVG: Current 50%/AVG

AVG: Average(50%) seasonal runoff voulme as simulated by the river
forecast model considering acontinuous simulation of the basin
response to historic climate data (observed precipitation and
temperatures) over the period of 1981-2010.

The 50%, 10% and 90% columns indicate the probability that the
actual volume will exceed the forecast for the valid time perion
for more information, please visit: www.weather.gov/mbrfc/water


$$


