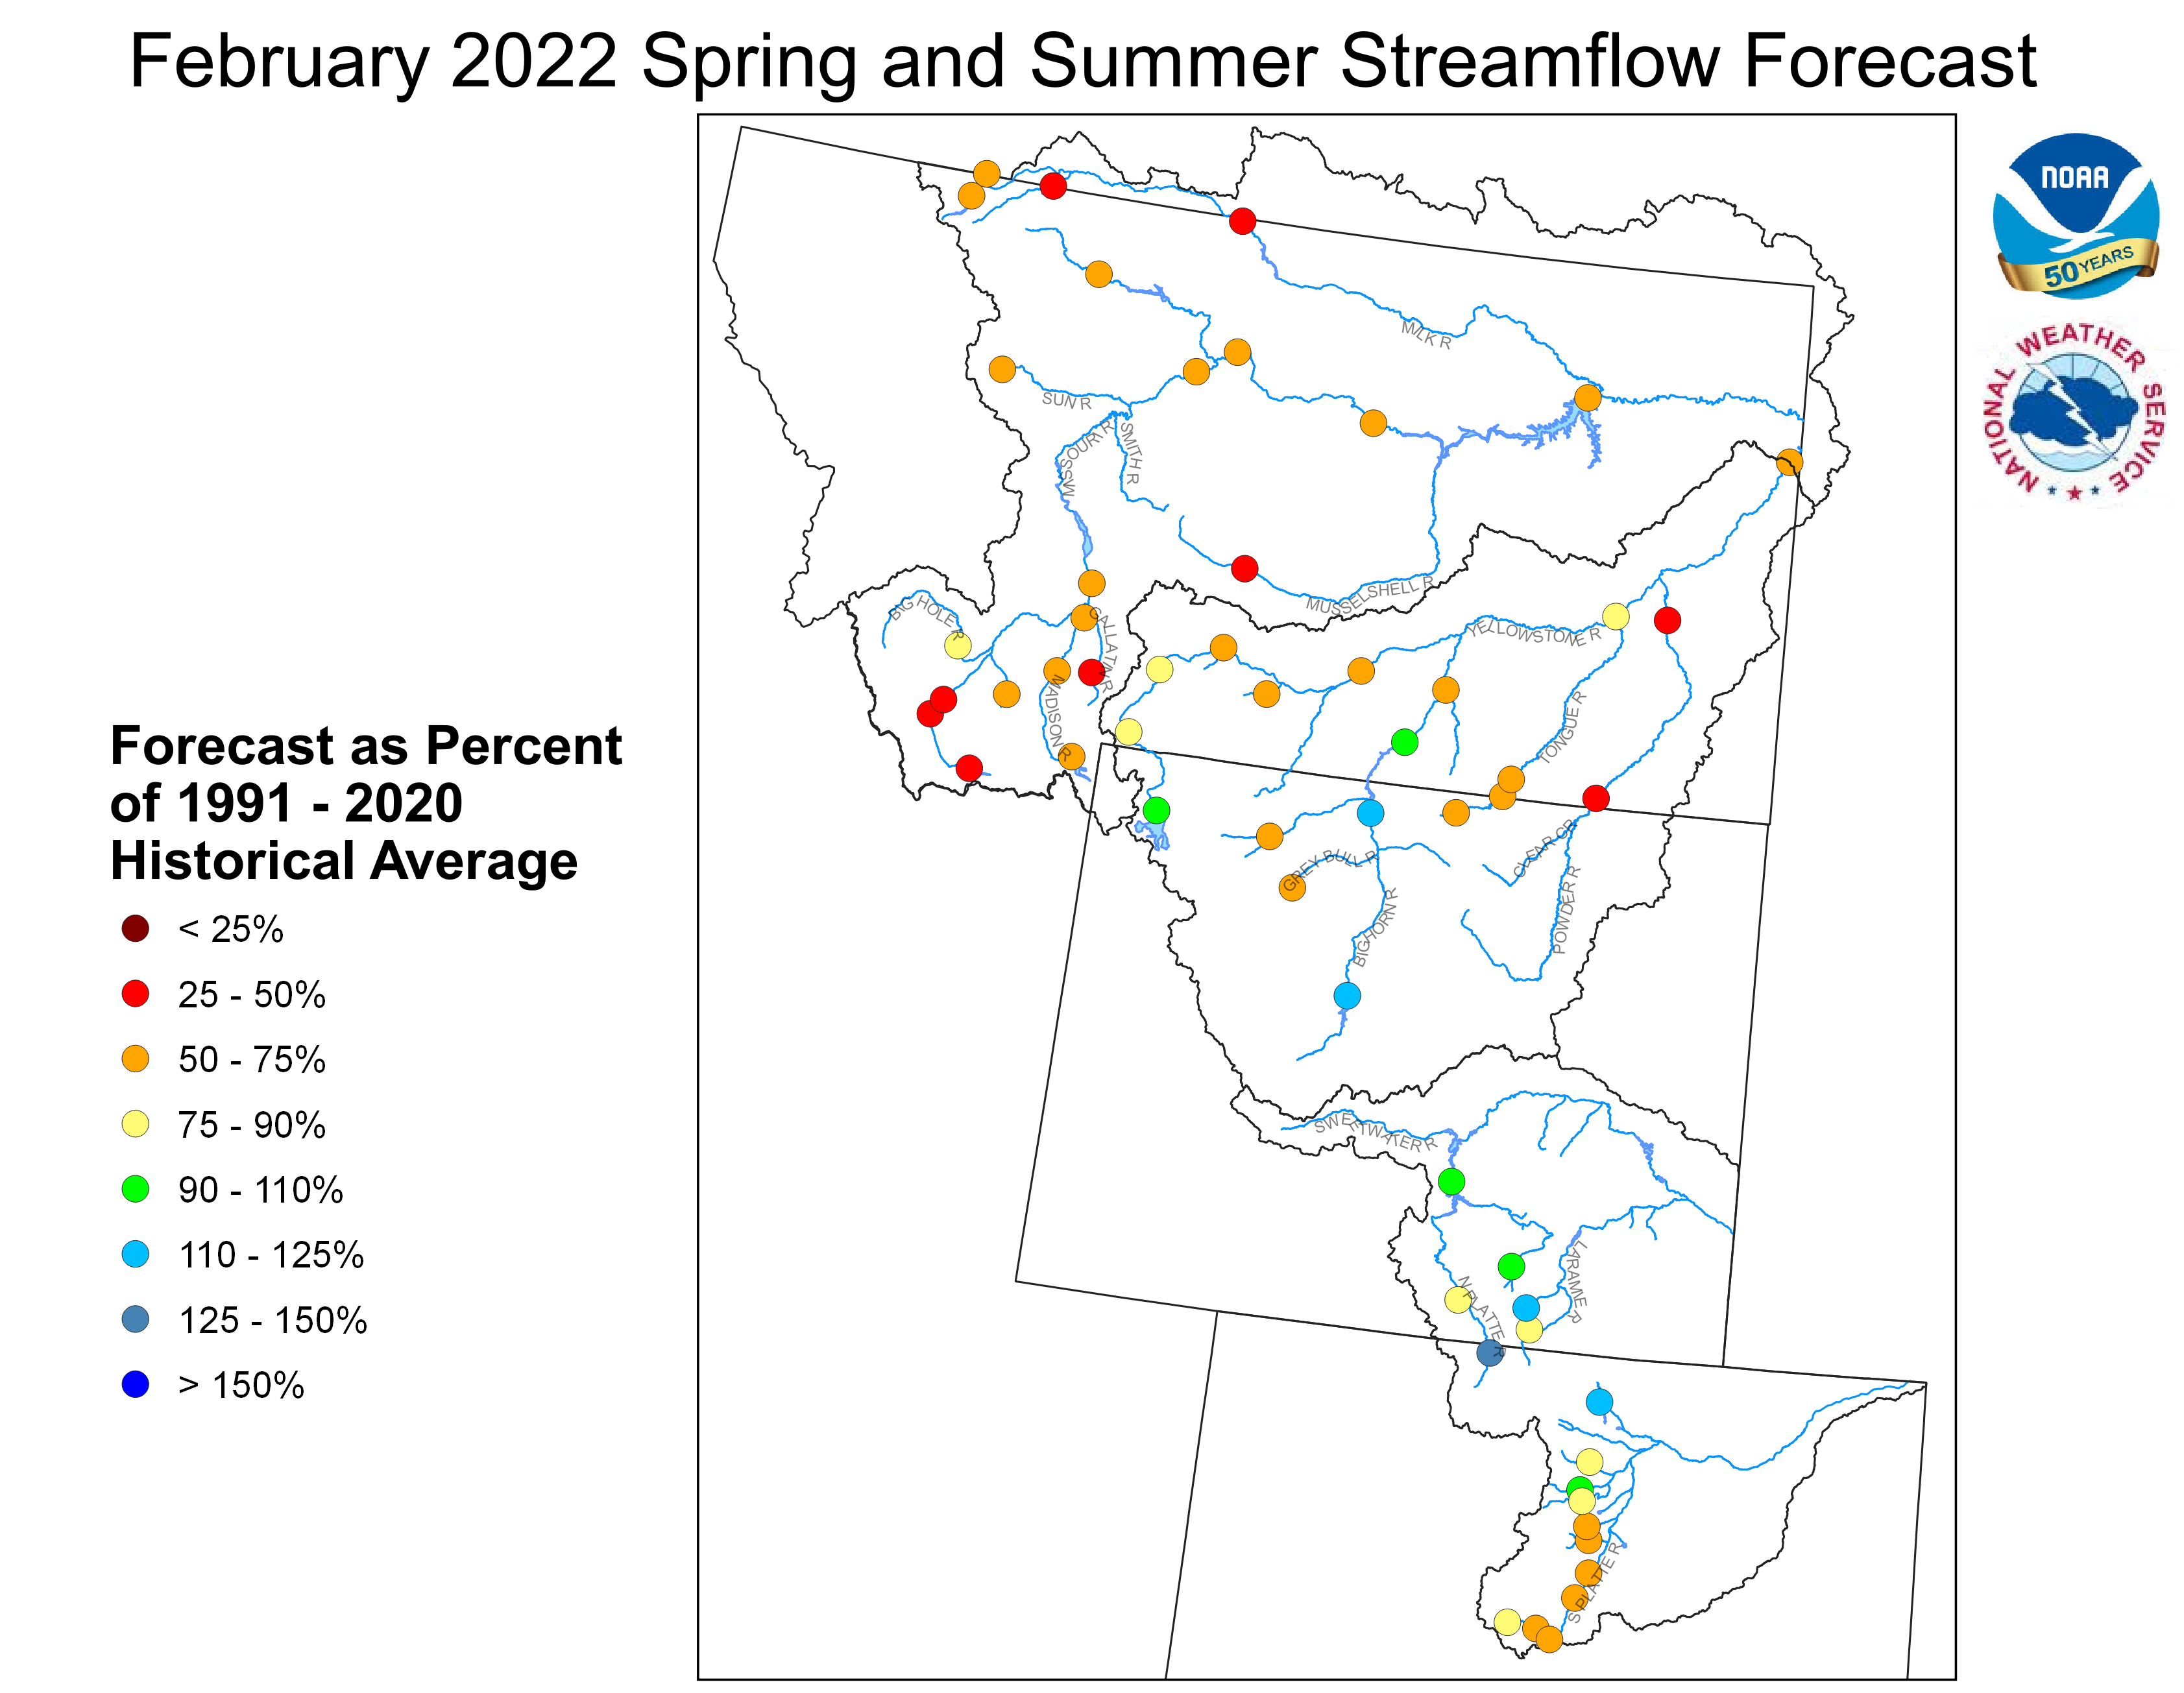
February 1, 2022 Spring and Summer Streamflow Forecasts
Upper Missouri Basin
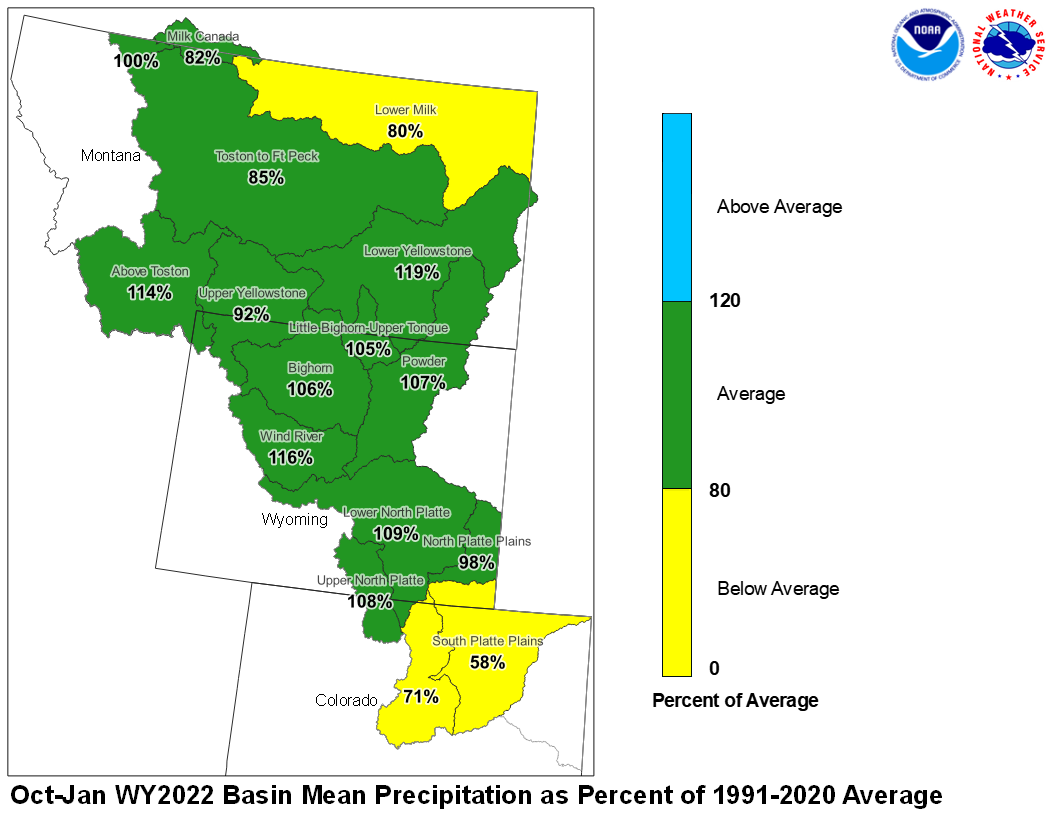
The high elevation snow pack in the Upper Missouri Basin as of February 1
was near to above average. The snow pack in the St. Mary Basin was 105 percent,
and the Milk River Basin was 94 percent.
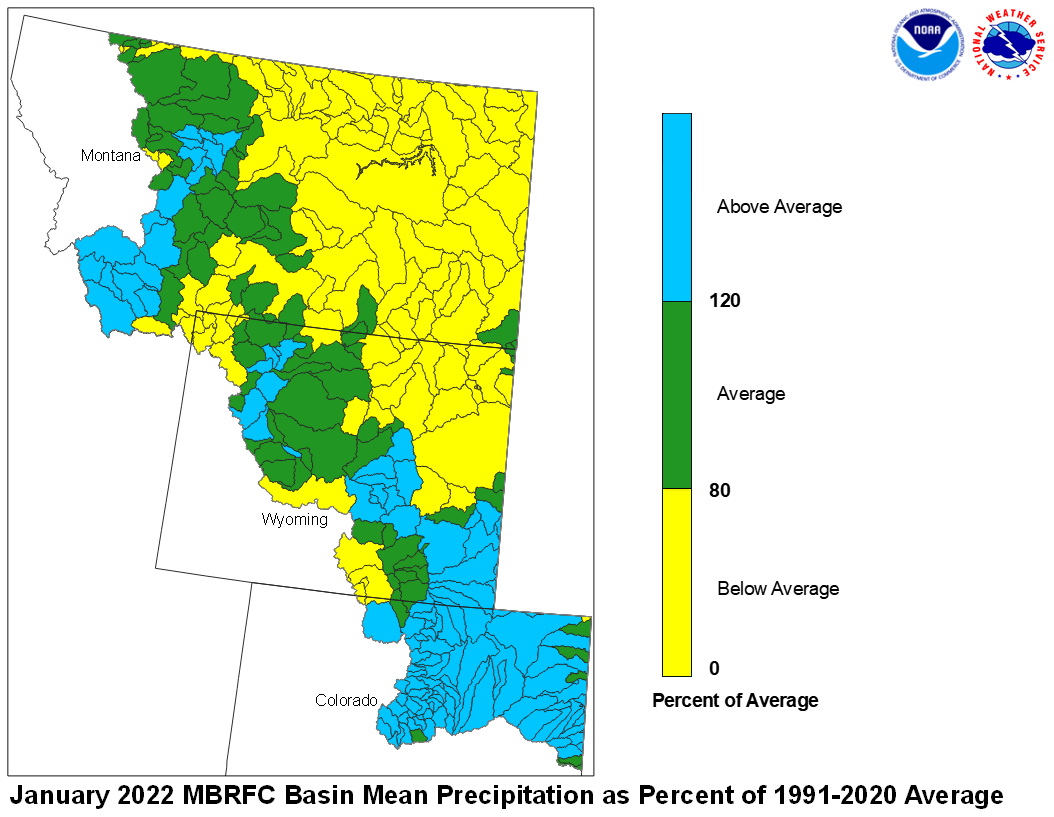
January precipitation across the Upper Missouri Basin was below average.
Basin precipitation summaries for the Missouri Basin include: Milk St. Mary,
81 percent; Milk Canada, 53 percent; Lower Milk, 35 percent; above Toston,
127 percent; Toston to Ft. Peck, 77 percent.
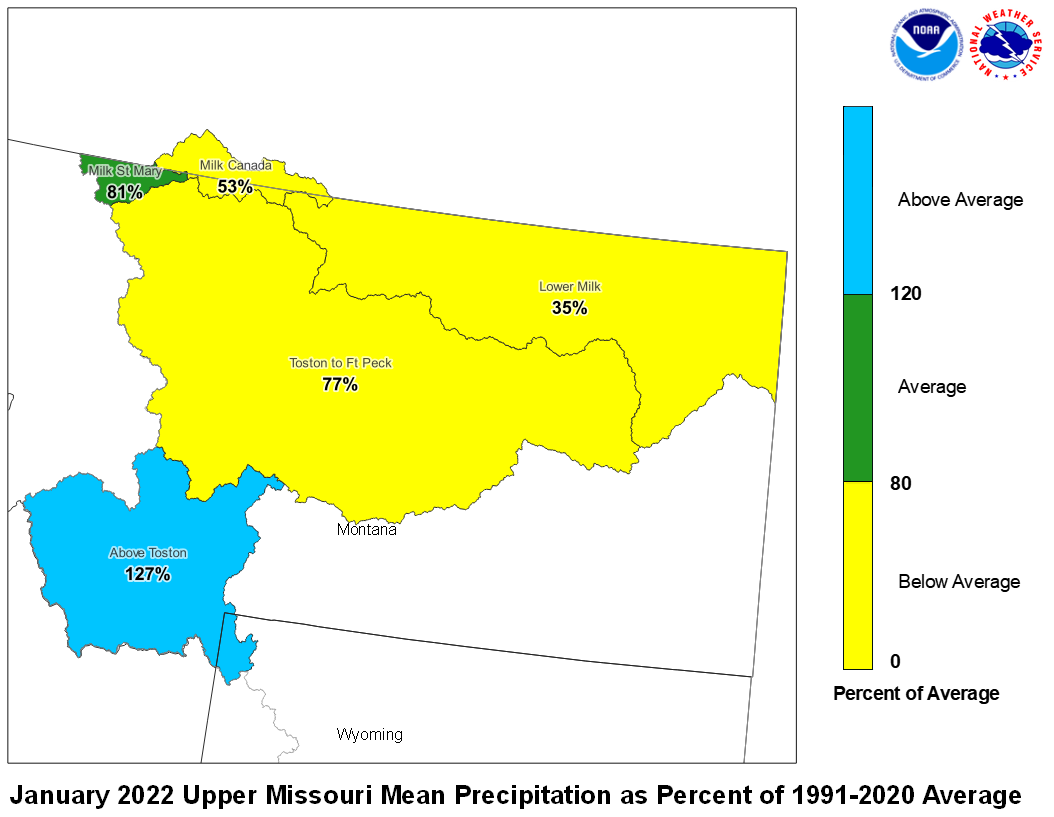
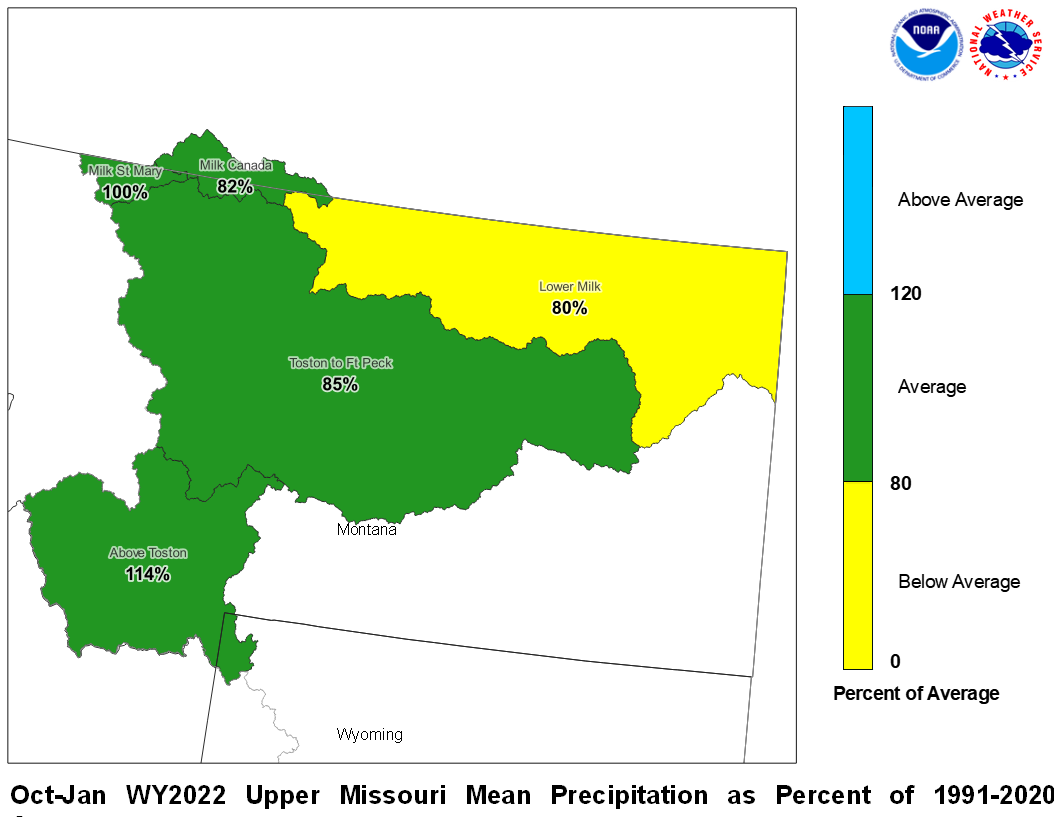
January 2022 Upper Missouri Mean Precip Oct-Jan WY2022 Upper Missouri Mean Precip
Stream flow in the Upper Missouri Basin is forecast to be
below average during the upcoming Spring and Summer.
The St. Mary River is forecast to have 61 percent of average
April-September flows. Runoff is expected to range around
65 percent of average for the Missouri Basin above Fort Peck,
Montana.
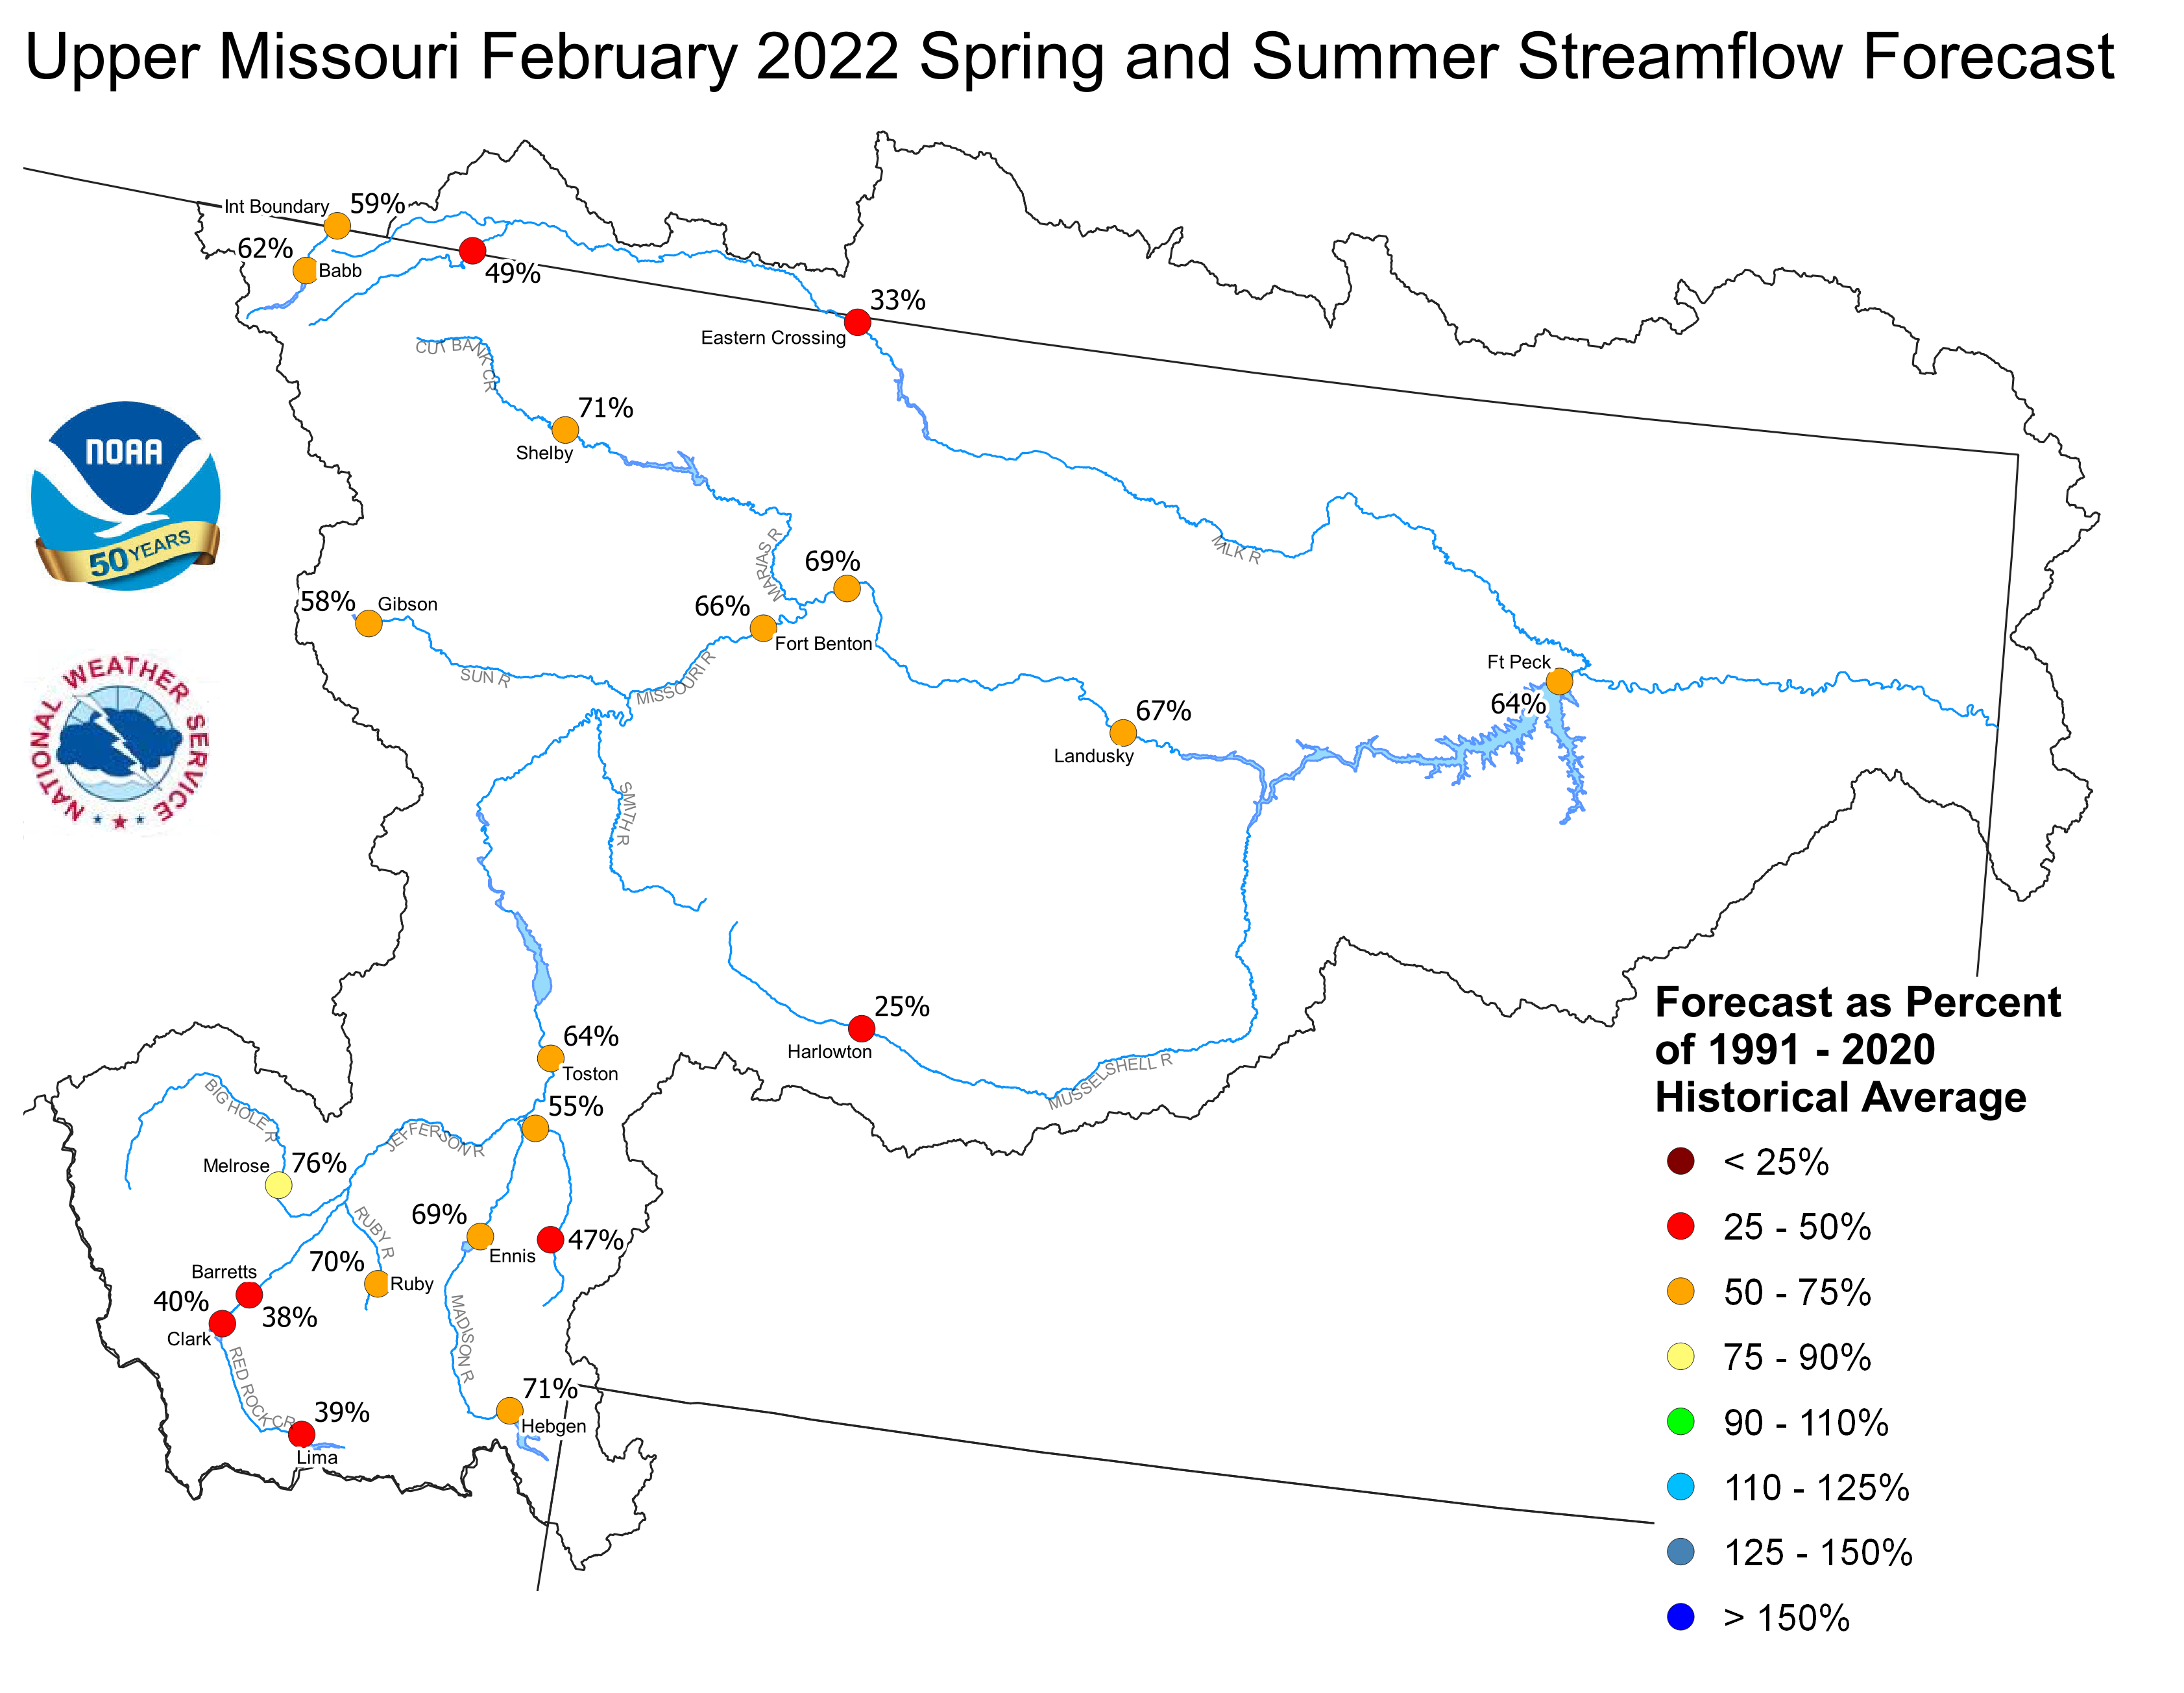
Upper Missouri February 1, 2022 Spring and Summer Streamflow Forecasts
Of the four major irrigation reservoirs in Montana; Lima
Reservoir had 71 percent average storage, Clark Canyon was
holding 74 percent of average water, Gibson Reservoir had 60
percent of average stored water, and Fresno Reservoir had
64 percent of average stored water.
Yellowstone Basin
The high elevation snow pack in the Yellowstone Basin was near to below average
on February 1. The snow pack in the Upper Yellowstone Basin was 85 percent
of average. The snow packs in the Wind, Bighorn, and Shoshone Basins were 106,
95, and 90 percent of average, respectively. The snow packs in the Tongue
and Powder basins were 90 and 81 percent of average, respectively.
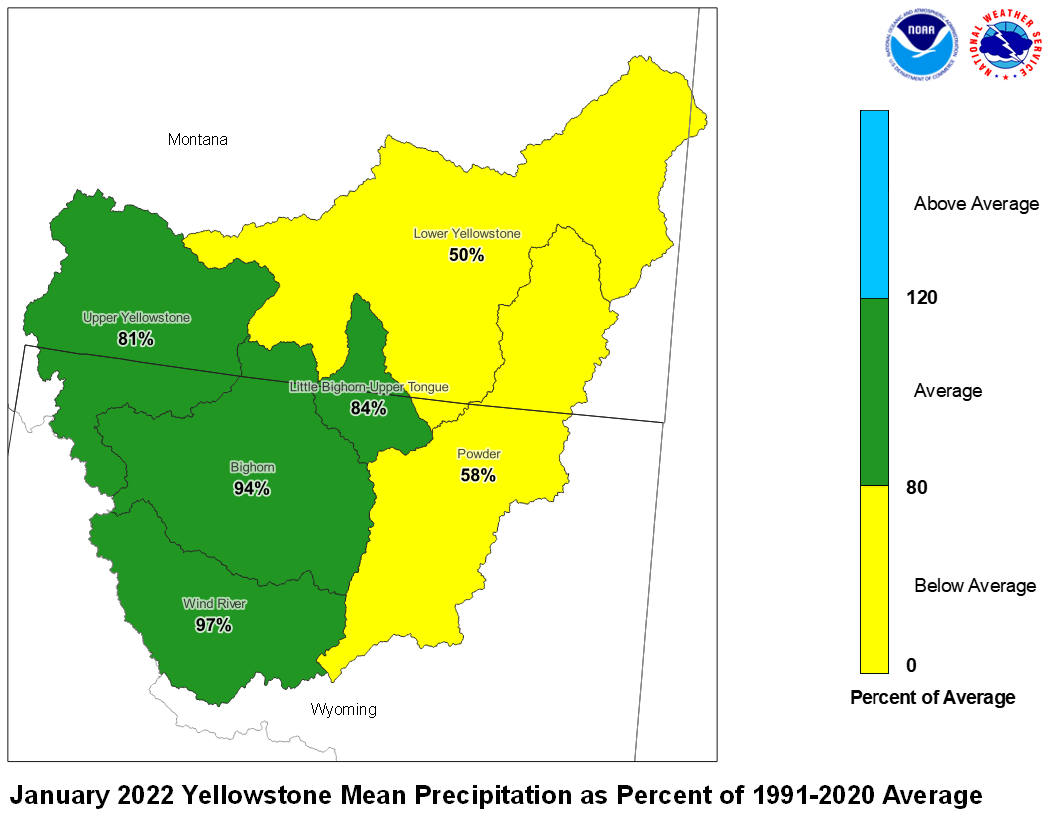
Precipitation during January was near to below average. The upper Yellowstone
River Basin received 81 percent of average precipitation while the
Lower Yellowstone River Basin reported 50 percent of average. The
Bighorn Basin received 94 percent of average precipitation while the
Wind River Basin received 97 percent of average. The Little Bighorn -
Upper Tongue Basin received 84 percent of average and the Powder River
had 58 percent of average precipitation.
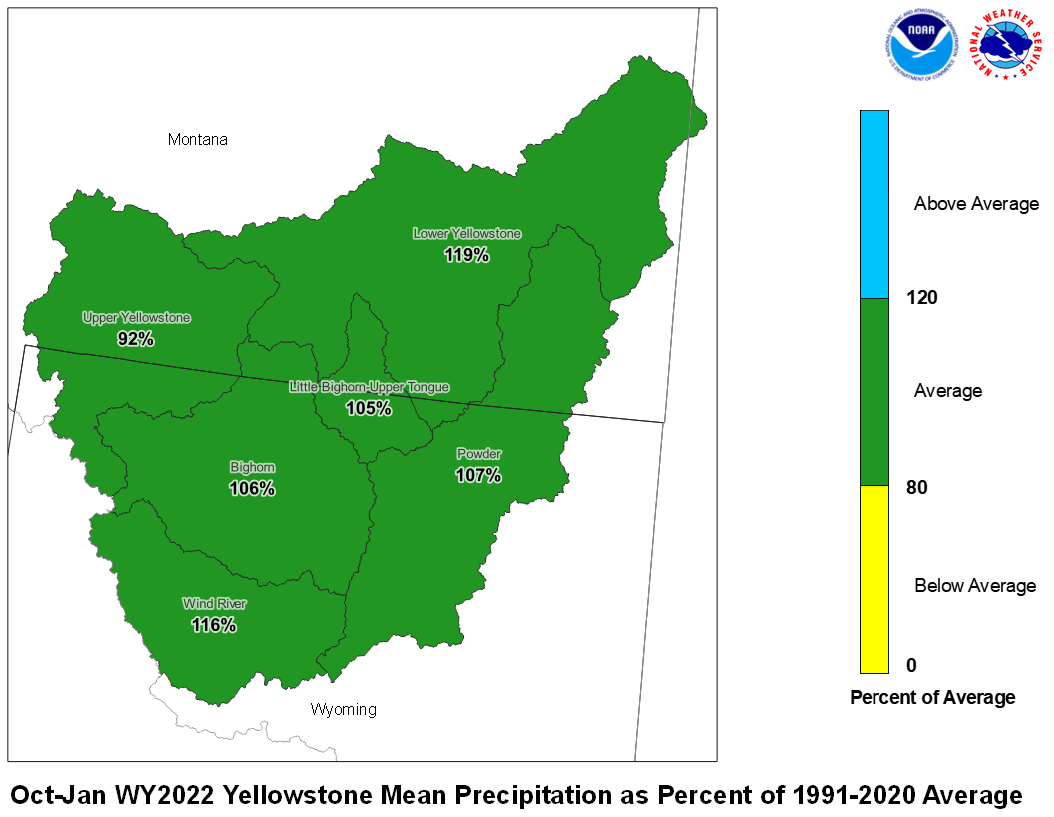
January 2022 Yellowstone Mean Precip Oct-Jan WY2022 Yellowstone Mean Precip
Forecast stream flow in the Yellowstone Basin is below average
for the upcoming Spring and Summer. Stream flow for the
Yellowstone River above Sidney, Montana is forecast to be about
72 percent of average. Flow in the Tongue Basin is expected to be
60 percent of average. Flows in the Powder River are expected
to be about 47 percent of average.
Monthend storage at Boysen Reservoir was 106 percent of average.
Stored water in Buffalo Bill Reservoir was 87 percent of average.
Monthend storage was 96 percent of average at Bighorn Reservoir.
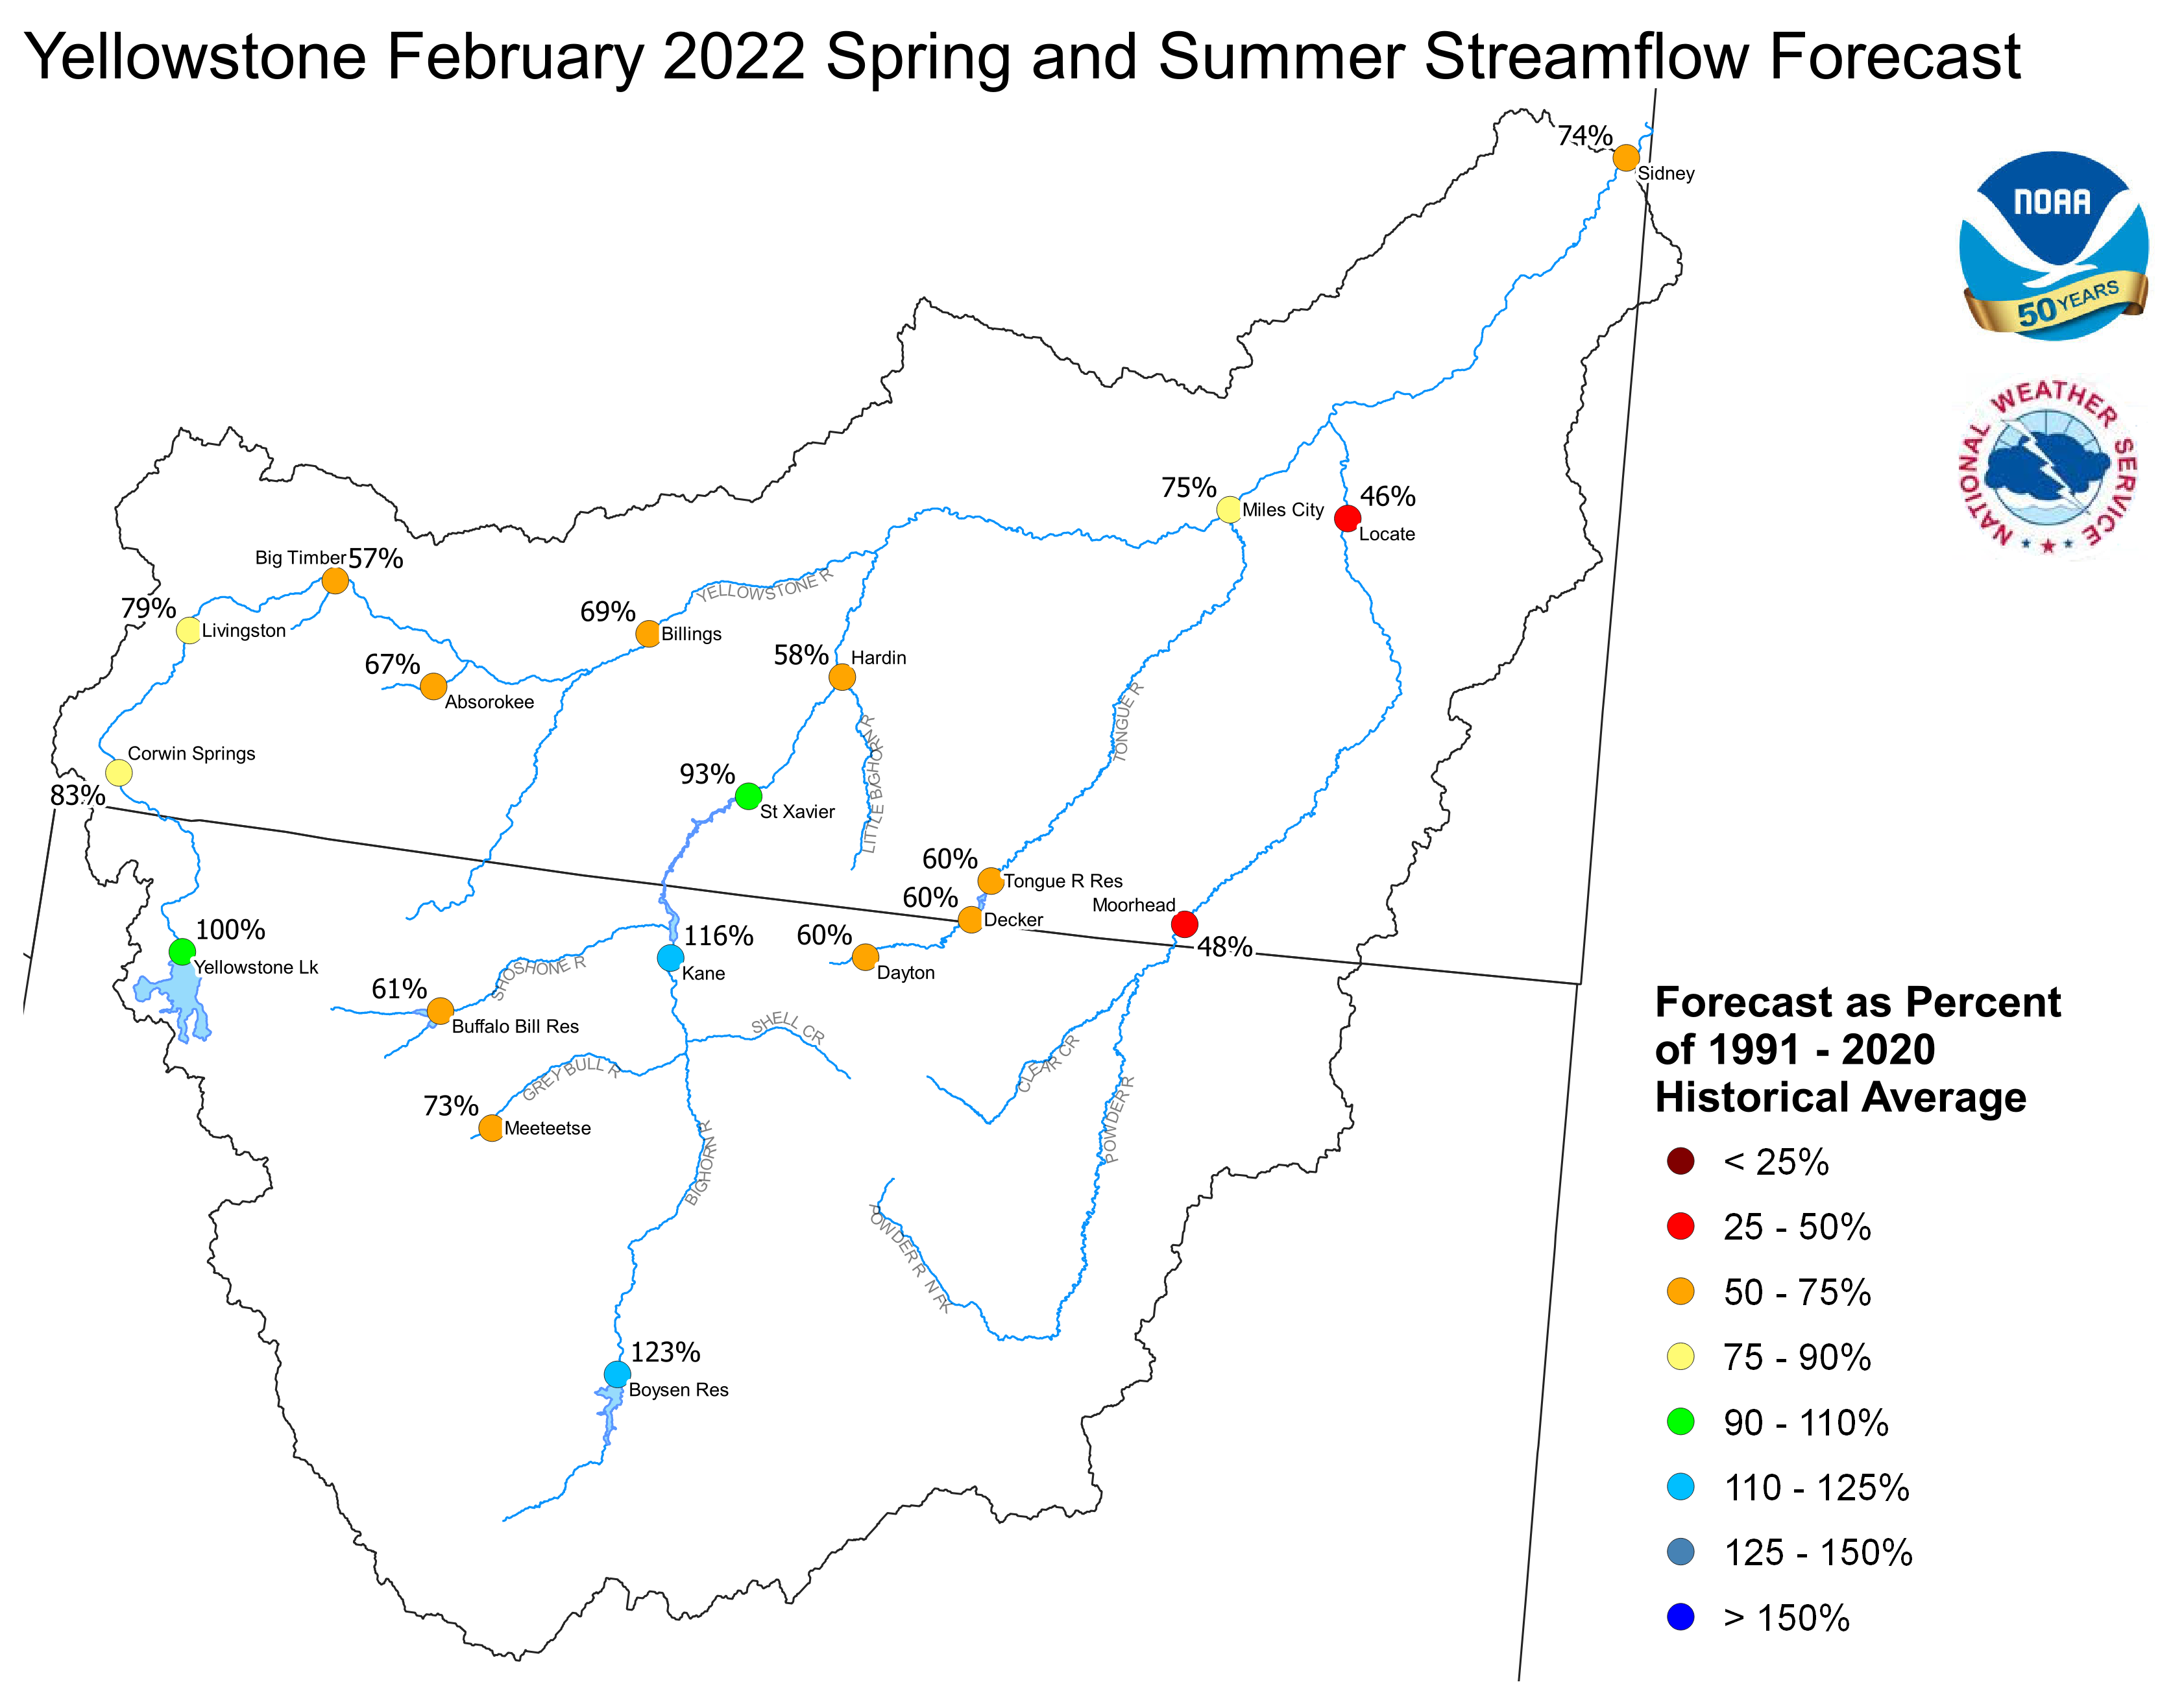
Yellowstone February 1, 2022 Spring and Summer Streamflow Forecasts
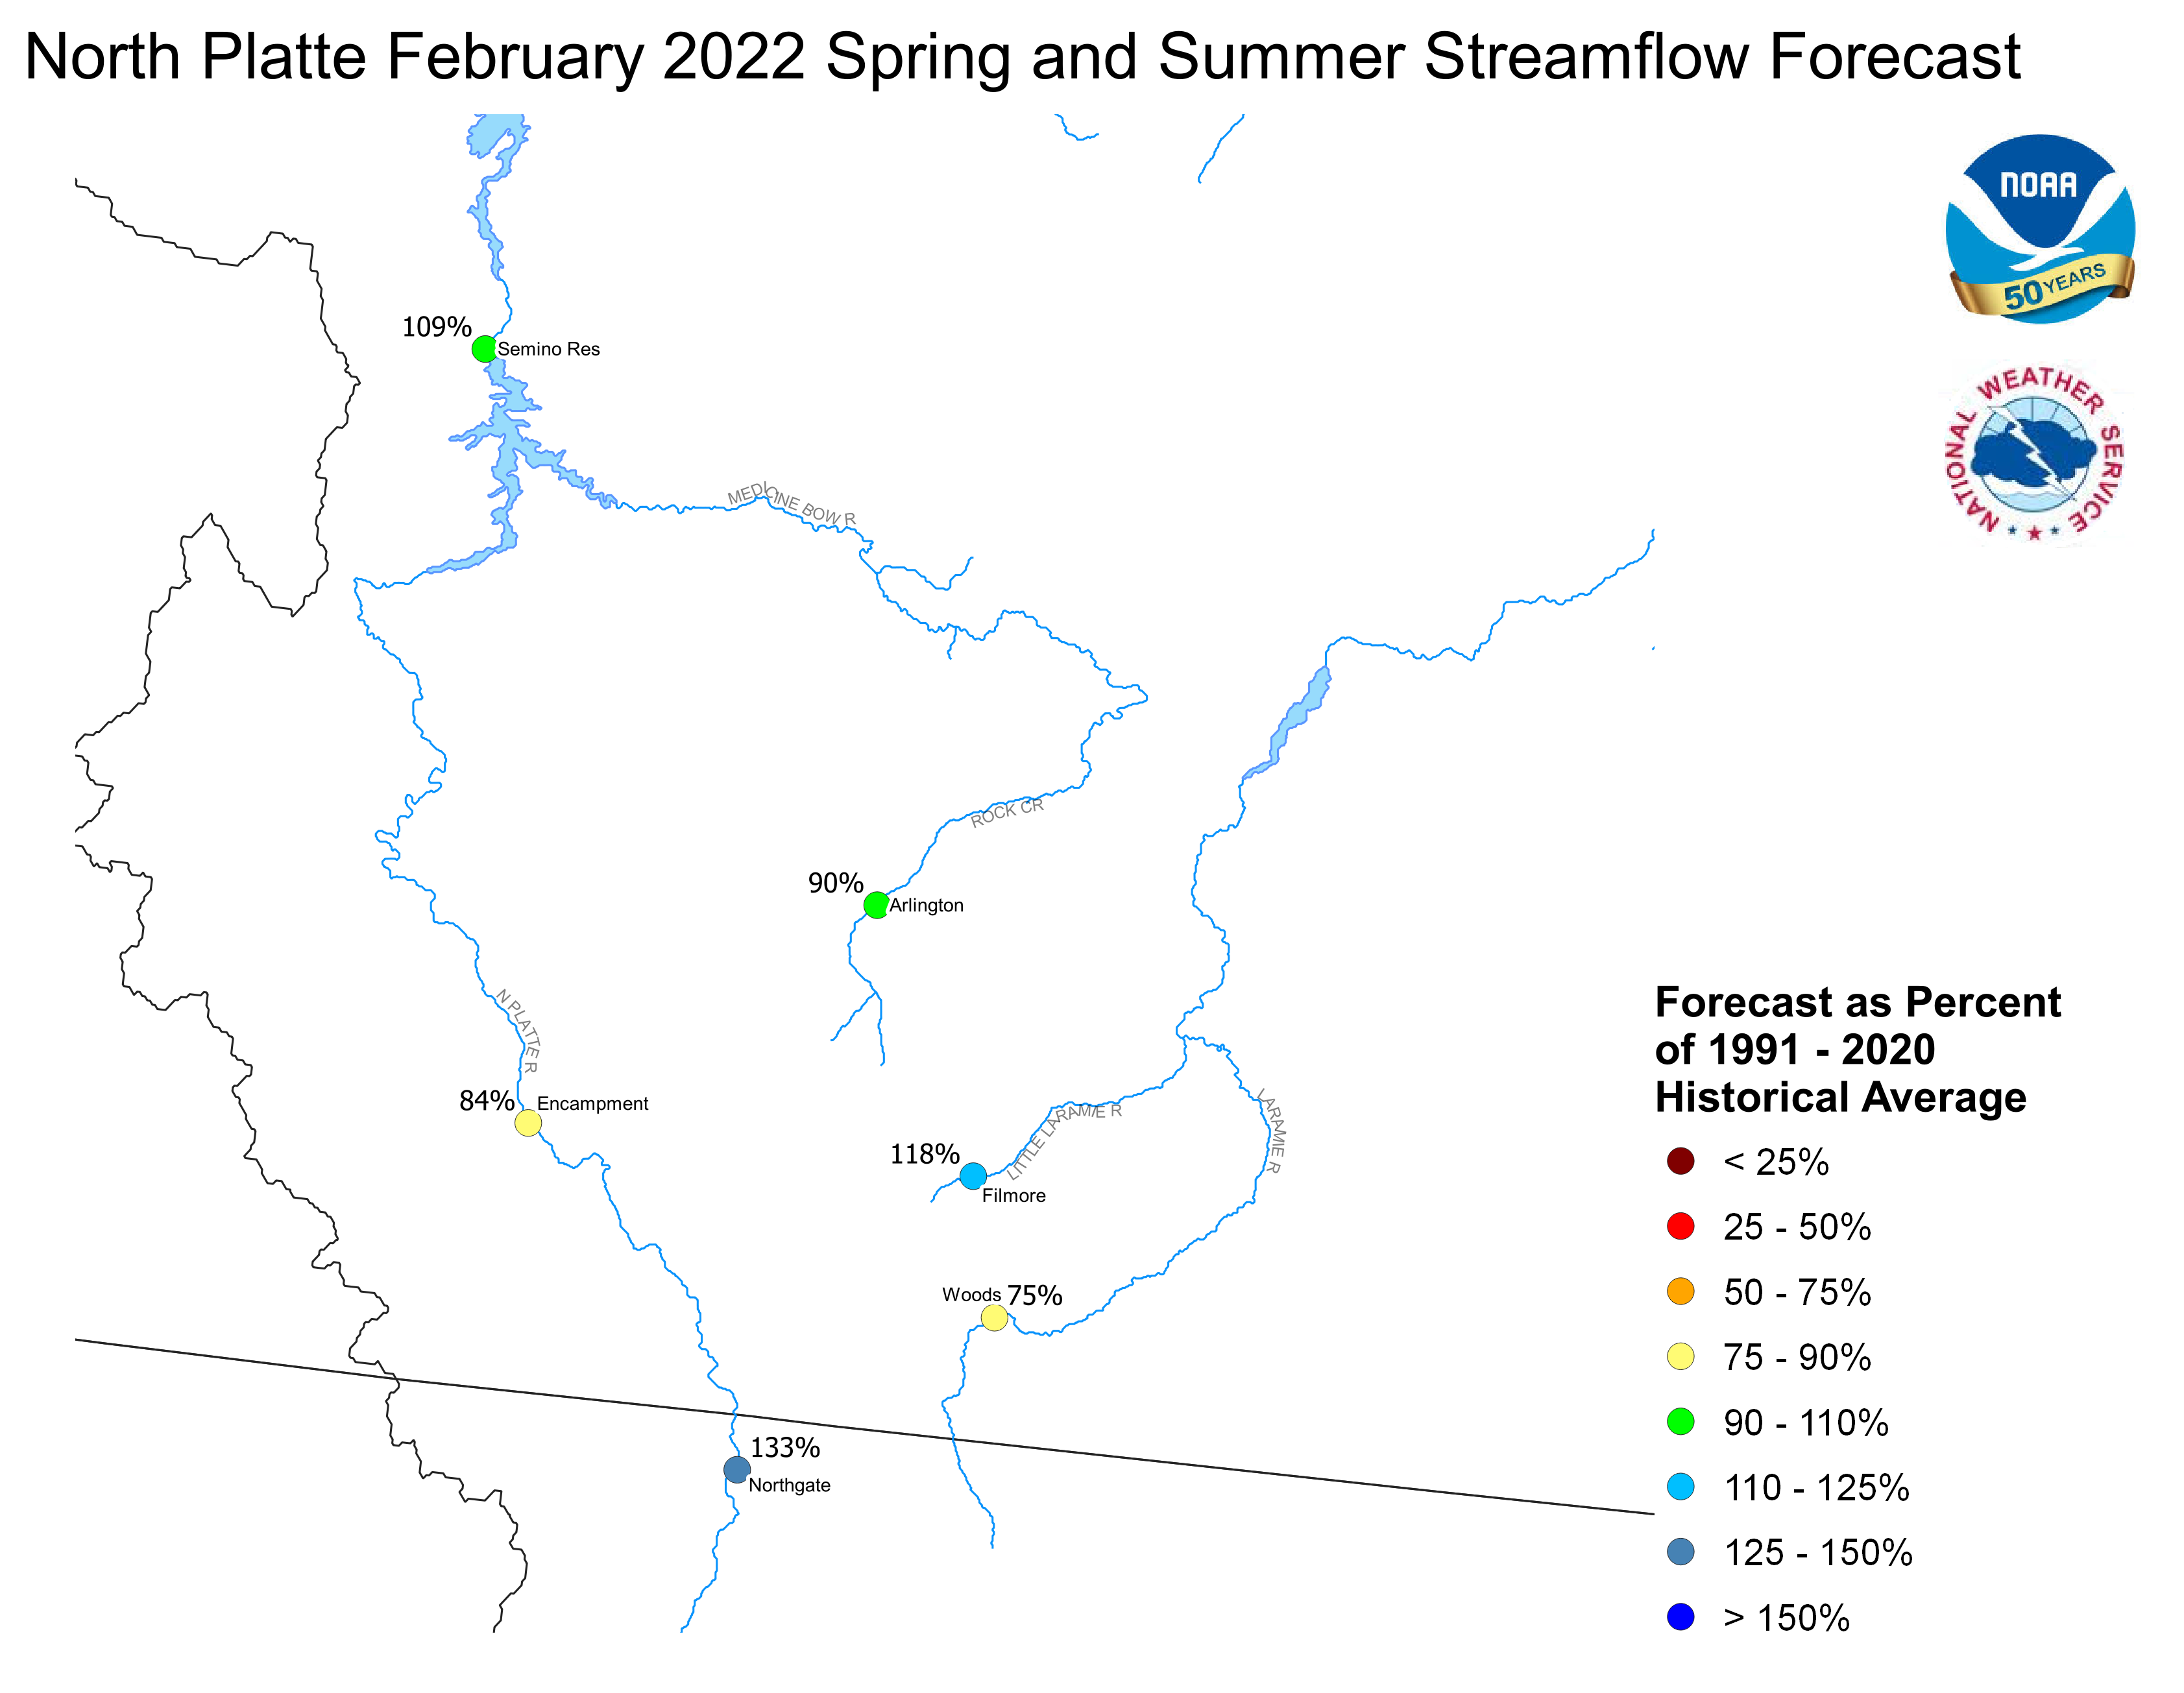
Platte Basin
The high elevation snow pack in the Upper North Platte Basin was
117 percent of average on February 1. The snow pack in the North Platte
Basin below Seminoe Reservoir was 112 percent of average. The snow
pack in the South Platte Basin was 113 percent of average.
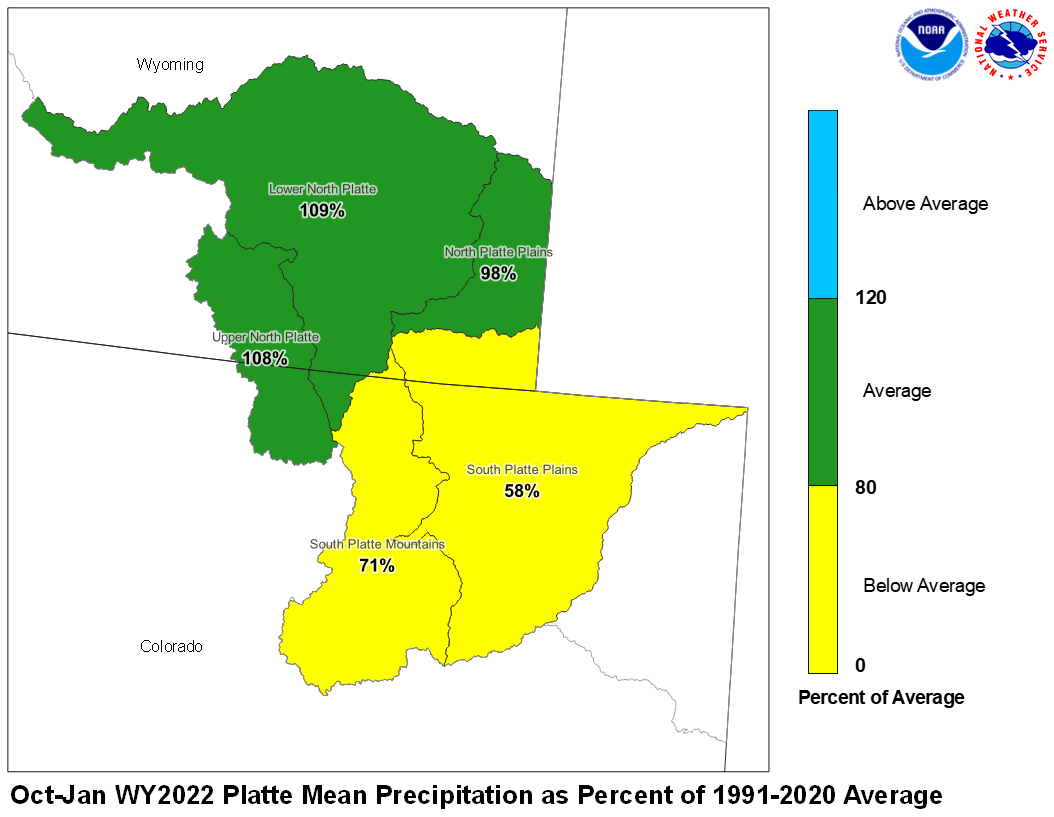
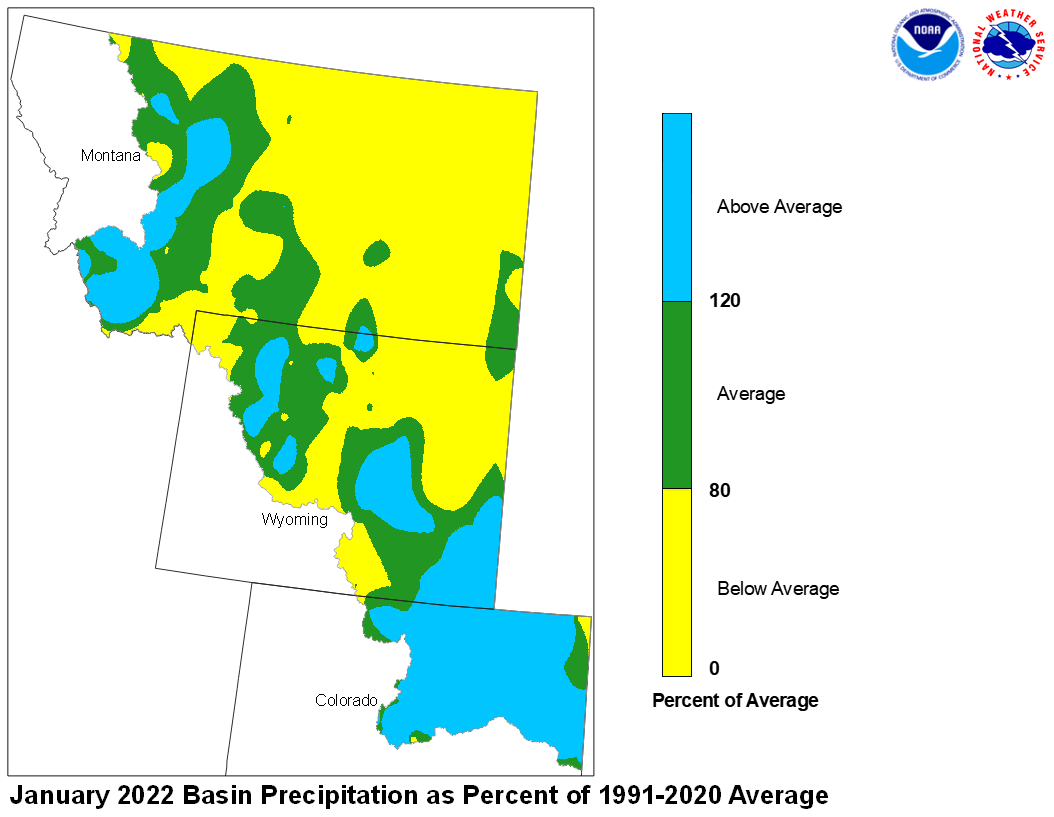
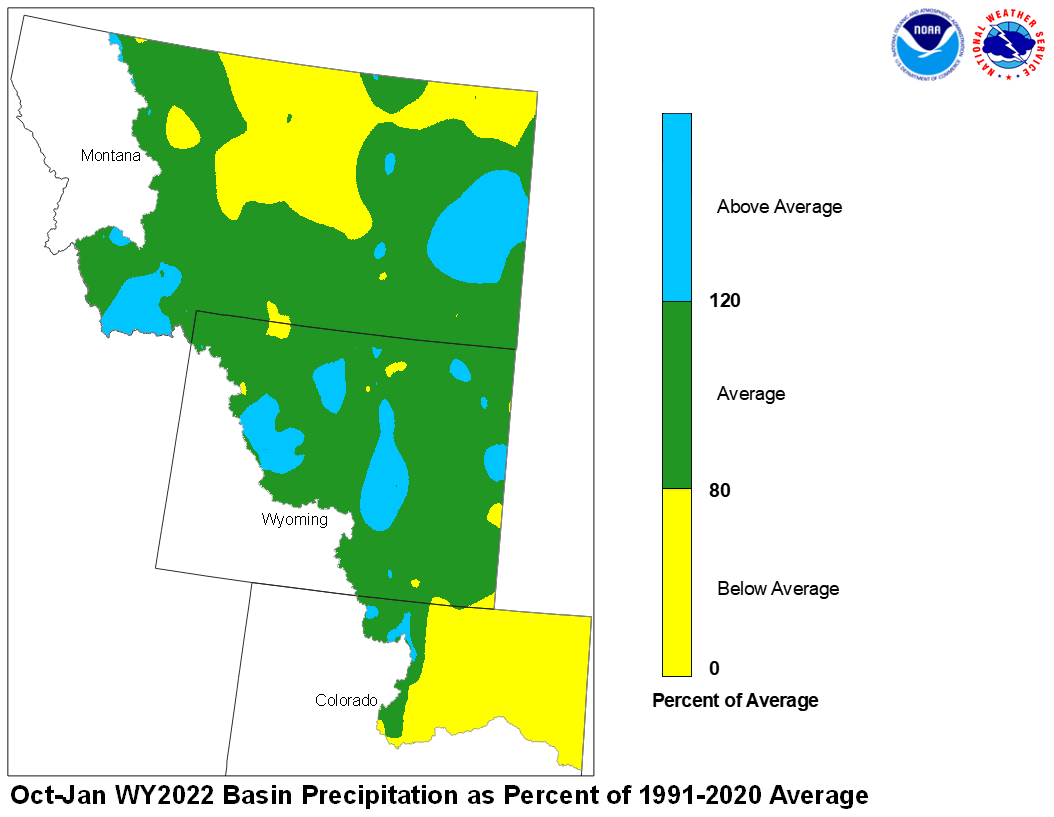
Precipitation during January in the Upper North Platte Basin was 89
percent of average. In the Lower North Platte Basin, precipitation
was 109 percent of average. The North Platte Plains below Guernsy
Reservoir had 212 percent. The South Platte Mountains had 199
percent whereas the Plains had 215 percent of average January
precipitation.

January 2022 Platte Mean Precip Oct-Jan WY2022 Platte Mean Precip
Stream flow in the Platte Basin is forecast to be below
average during the upcoming Spring and Summer. Runoff
for streams above Seminoe Reservoir are expected to be
about 95 percent of average. Streams in the South Platte
Basin above South Platte, Colorado can expect 80 percent
of average flow. For the remainder of the South Platte
basin, flows are expected near 72 percent.
Stored water in the South Platte Basin was 104 percent of average
on February 1.
North Platte Streamflow Fcst South Platte Streamflow Fcst
FGUS63 KKRF 021339
ESPKRF
WATER SUPPLY FORECAST
NWS MISSOURI BASIN RIVER FORECAST CENTER
PLEASANT HILL MISSOURI

0733 CST WEDNESDAY FEBRUARY 02, 2022

DATA CURRENT AS OF: FEBRUARY 01, 2022

MISSOURI/YELLOWSTONE/PLATTE RIVER BASIN FORECASTS


                                          50%   %   10%   90%   AVG
FORECAST POINT                   PERIOD  (KAF) AVG (KAF) (KAF) (KAF)
--------------------------------------------------------------------

Boysen Resvr Inflow              Apr-Sep  607   84  1126  268    720
 SBDW4

Boysen Resvr Inflow              Apr-Sep 1093  123  1667  646    890
 SBDW4N

Bighorn R at Kane                Apr-Sep  924   94  1722  531    985
 LVEW4

Bighorn R at Kane                Apr-Sep 1666  116  2523 1013   1440
 LVEW4N

Greybull R at Meeteetse          Apr-Sep  149   76   231   64    196
 MEEW4

Greybull R at Meeteetse          Apr-Sep  149   73   231   64    205
 MEEW4N

Buffalo Bill Resvr Inflow        Apr-Sep  472   58   748  349    815
 CDYW4

Buffalo Bill Resvr Inflow        Apr-Sep  556   61   842  427    910
 CDYW4N

St. Mary R nr Babb               Apr-Sep  354   77   446  305    460
 SMYM8

St. Mary R nr Babb               Apr-Sep  332   62   425  284    535
 SMYM8N

St. Mary R at Intl Boundary      Apr-Sep  273   70   407  215    390
 SMBM8

St. Mary R at Intl Boundary      Apr-Sep  387   59   514  328    660
 SMBM8N

Milk R nr Western Crossing       Apr-Sep   12   11    35    6    113
 PDBM8

Milk R nr Western Crossing       Apr-Sep   20   49    48   10     41
 PDBM8N

Milk R nr Eastern Crossing       Apr-Sep  147   68   212  138    215
 ERNM8

Milk R nr Eastern Crossing       Apr-Sep   37   33   133   19    112
 ERNM8N

North Platte R nr Northgate      Apr-Sep  336  137   558  204    245
 NGTC2

North Platte R nr Northgate      Apr-Sep  391  133   610  258    295
 NGTC2N

Encampment R nr Encampment       Apr-Sep  128   82   181   90    156
 ECRW4

Encampment R nr Encampment       Apr-Sep  139   84   191  101    166
 ECRW4N

Rock Cr nr Arlington             Apr-Sep   48   90    65   36     53
 KCRW4

Rock Cr nr Arlington             Apr-Sep   48   90    65   37     53
 KCRW4N

Seminoe Resvr Inflow             Apr-Sep  837  109  1149  564    765
 SETW4

Seminoe Resvr Inflow             Apr-Sep  998  109  1306  726    920
 SETW4N

Laramie R nr Woods Landing       Apr-Sep   72   66   137   37    108
 WODW4

Laramie R nr Woods Landing       Apr-Sep  107   75   172   67    142
 WODW4N

Little Laramie R nr Filmore      Apr-Sep   65  119   101   48     55
 SMTW4

Little Laramie R nr Filmore      Apr-Sep   68  118   104   50     57
 SMTW4N

Antero Resvr Inflow              Apr-Sep   11   79    18    6     14
 ANRC2

Antero Resvr Inflow              Apr-Sep   11   79    18    6     14
 ANRC2N

Spinney Mountain Resvr Inflow    Apr-Sep   42   74    83   28     57
 SPYC2

Spinney Mountain Resvr Inflow    Apr-Sep   33   73    74   17     45
 SPYC2N

Elevenmile Canyon Resvr Inflow   Apr-Sep   38   64    66   33     59
 EVNC2

Elevenmile Canyon Resvr Inflow   Apr-Sep   36   73    77   18     50
 EVNC2N

Cheesman Lk Inflow               Apr-Sep   65   65   113   44    100
 CHEC2

Cheesman Lk Inflow               Apr-Sep   68   73   131   38     93
 CHEC2N

S Platte R at S Platte           Apr-Sep  319  133   397  292    240
 SPTC2

S Platte R at S Platte           Apr-Sep  137   67   229   78    205
 SPTC2N

Bear Cr at Morrison              Apr-Sep   14   54    28    7     26
 MRRC2

Bear Cr at Morrison              Apr-Sep   14   54    28    7     26
 MRRC2N

Clear Cr at Golden               Apr-Sep   81   69   127   46    118
 GLDC2

Clear Cr at Golden               Apr-Sep   92   70   140   54    131
 GLDC2N

St. Vrain Cr at Lyons            Apr-Sep   65   83    97   43     79
 LNSC2

St. Vrain Cr at Lyons            Apr-Sep   92   84   143   63    109
 LNSC2N

Boulder Cr nr Orodell            Apr-Sep   41   86    65   26     47
 OROC2

Boulder Cr nr Orodell            Apr-Sep   56  108    81   38     52
 OROC2N

S Boulder Cr nr Eldorado Sprgs   Apr-Sep   30   85    43   15     35
 BELC2

S Boulder Cr nr Eldorado Sprgs   Apr-Sep   32   81    52   15     40
 BELC2N

Cache La Poudre at Canyon Mouth  Apr-Sep  209  193   315  116    108
 FTDC2

Cache La Poudre at Canyon Mouth  Apr-Sep  241  115   349  143    210
 FTDC2N

Lima Resvr Inflow                Apr-Sep   31   41    53   20     76
 LRRM8

Lima Resvr Inflow                Apr-Sep   31   39    53   20     79
 LRRM8N

Clark Canyon Resvr Inflow        Apr-Sep   39   36    56   29    110
 CLKM8

Clark Canyon Resvr Inflow        Apr-Sep   79   40   126   50    198
 CLKM8N

Beaverhead R at Barretts         Apr-Sep  121   61   138  111    199
 BARM8

Beaverhead R at Barretts         Apr-Sep  107   38   156   74    280
 BARM8N

Ruby R Resvr Inflow              Apr-Sep   68   77    83   51     88
 ALRM8

Ruby R Resvr Inflow              Apr-Sep   68   70    83   51     97
 ALRM8N

Big Hole R nr Melrose            Apr-Sep  439   74   608  276    595
 MLRM8

Big Hole R nr Melrose            Apr-Sep  505   76   678  341    660
 MLRM8N

Hebgen Resvr Inflow              Apr-Sep  328   71   402  249    465
 HBDM8

Hebgen Resvr Inflow              Apr-Sep  328   71   402  249    465
 HBDM8N

Ennis Resvr Inflow               Apr-Sep  477   67   545  391    715
 ELMM8

Ennis Resvr Inflow               Apr-Sep  503   69   617  392    730
 ELMM8N

Gallatin R nr Gateway            Apr-Sep  225   47   295  185    475
 GLGM8

Gallatin R nr Gateway            Apr-Sep  225   47   295  185    475
 GLGM8N

Gallatin R at Logan              Apr-Sep  218   43   327  147    505
 LOGM8

Gallatin R at Logan              Apr-Sep  355   55   467  271    650
 LOGM8N

Missouri R at Toston             Apr-Sep 1191   58  1686  844   2060
 TOSM8

Missouri R at Toston             Apr-Sep 1818   64  2416 1387   2830
 TOSM8N

Missouri R at Fort Benton        Apr-Sep 1715   56  1909 1569   3060
 FBNM8

Missouri R at Fort Benton        Apr-Sep 2688   66  3398 2016   4100
 FBNM8N

Missouri R nr Virgelle           Apr-Sep 1840   54  2189 1681   3420
 VRGM8

Missouri R nr Virgelle           Apr-Sep 3133   69  4072 2341   4560
 VRGM8N

Missouri R nr Landusky           Apr-Sep 1928   52  2276 1700   3680
 LDKM8

Missouri R nr Landusky           Apr-Sep 3270   67  4264 2427   4890
 LDKM8N

Missouri R below Fort Peck Dam   Apr-Sep 2014   52  2410 1738   3840
 FPKM8

Missouri R below Fort Peck Dam   Apr-Sep 3341   64  4371 2461   5180
 FPKM8N

Gibson Resvr Inflow              Apr-Sep  260   58   413  175    450
 AGSM8

Gibson Resvr Inflow              Apr-Sep  260   58   413  175    450
 AGSM8N

Marias R nr Shelby               Apr-Sep  295   68   532  196    435
 SHLM8

Marias R nr Shelby               Apr-Sep  348   71   594  243    490
 SHLM8N

Musselshell R at Harlowton       Apr-Sep   17   21    40   13     80
 HLWM8

Musselshell R at Harlowton       Apr-Sep   23   25    48   19     95
 HLWM8N

Yellowstone R at Yellowstone Lk  Apr-Sep  621   76   762  490    815
 YLOW4

Yellowstone R at Yellowstone Lk  Apr-Sep  840  100   982  655    840
 YLOW4N

Yellowstone R at Corwin Sprgs    Apr-Sep 1400   71  1709 1088   1980
 CORM8

Yellowstone R at Corwin Sprgs    Apr-Sep 1708   83  2016 1328   2070
 CORM8N

Yellowstone R at Livingston      Apr-Sep 1581   69  1893 1219   2290
 LIVM8

Yellowstone R at Livingston      Apr-Sep 1938   79  2265 1530   2440
 LIVM8N

Yellowstone R at Billings        Apr-Sep 2279   56  2689 1502   4070
 BILM8

Yellowstone R at Billings        Apr-Sep 3293   69  3734 2521   4790
 BILM8N

Yellowstone R at Miles City      Apr-Sep 3387   58  4694 2595   5850
 MILM8

Yellowstone R at Miles City      Apr-Sep 5757   75  7446 4486   7690
 MILM8N

Yellowstone R at Sidney          Apr-Sep 3241   57  4626 2478   5710
 SIDM8

Yellowstone R at Sidney          Apr-Sep 5926   74  7645 4565   8060
 SIDM8N

Boulder R at Big Timber          Apr-Sep  173   52   235  113    335
 BTMM8

Boulder R at Big Timber          Apr-Sep  215   57   277  154    375
 BTMM8N

Stillwater R nr Absarokee        Apr-Sep  344   64   450  252    540
 SRAM8

Stillwater R nr Absarokee        Apr-Sep  401   67   504  310    595
 SRAM8N

Clks Fk Yellowstone R nr Belfry  Apr-Sep  364   59   489  256    620
 BFYM8

Clks Fk Yellowstone R nr Belfry  Apr-Sep  436   63   561  330    695
 BFYM8N

Bighorn R nr St. Xavier          Apr-Sep 1092   76  1706  759   1430
 STXM8

Bighorn R nr St. Xavier          Apr-Sep 2291   93  3321 1609   2460
 STXM8N

Little Bighorn R nr Hardin       Apr-Sep   73   58   153   46    127
 HRDM8

Little Bighorn R nr Hardin       Apr-Sep   73   58   153   46    127
 HRDM8N

Tongue R nr Dayton               Apr-Sep   55   58    70   37     96
 DAYW4

Tongue R nr Dayton               Apr-Sep   61   60    76   43    101
 DAYW4N

Tongue R nr Decker               Apr-Sep   99   42   149   47    235
 DSLM8

Tongue R nr Decker               Apr-Sep  145   60   198   86    240
 DSLM8N

Tongue R Resvr Inflow            Apr-Sep  101   43   155   47    235
 DKRM8

Tongue R Resvr Inflow            Apr-Sep  146   60   205   86    245
 DKRM8N

Powder R at Moorhead             Apr-Sep   93   42   230   34    225
 MHDM8

Powder R at Moorhead             Apr-Sep  130   48   274   57    270
 MHDM8N

Powder R nr Locate               Apr-Sep   98   38   270   36    260
 LOCM8

Powder R nr Locate               Apr-Sep  139   46   313   61    305
 LOCM8N


Locations with an `N` suffix indicate natural flows excluding
stream augmentations.

KAF: Thousands of Acre-feet

%AVG: Current 50%/AVG

AVG: Average(50%) seasonal runoff voulme as simulated by the river
forecast model considering acontinuous simulation of the basin
response to historic climate data (observed precipitation and
temperatures) over the period of 1981-2010.

The 50%, 10% and 90% columns indicate the probability that the
actual volume will exceed the forecast for the valid time perion
for more information, please visit: www.weather.gov/mbrfc/water


$$


