February 1, 2021 Spring and Summer Streamflow Forecasts
Upper Missouri Basin
The high elevation snow pack in the Upper Missouri Basin as of February 1
was near to above average. The snow pack in the St. Mary Basin was 110 percent, and the
Milk River Basin was 145 percent.
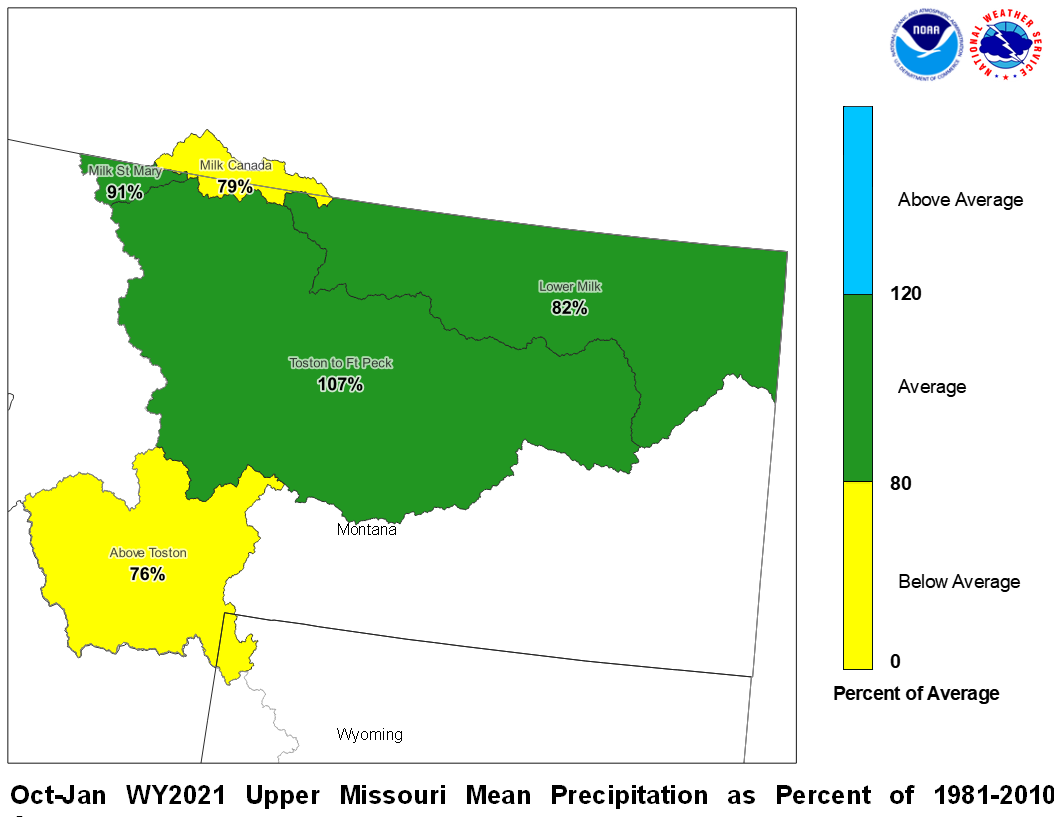
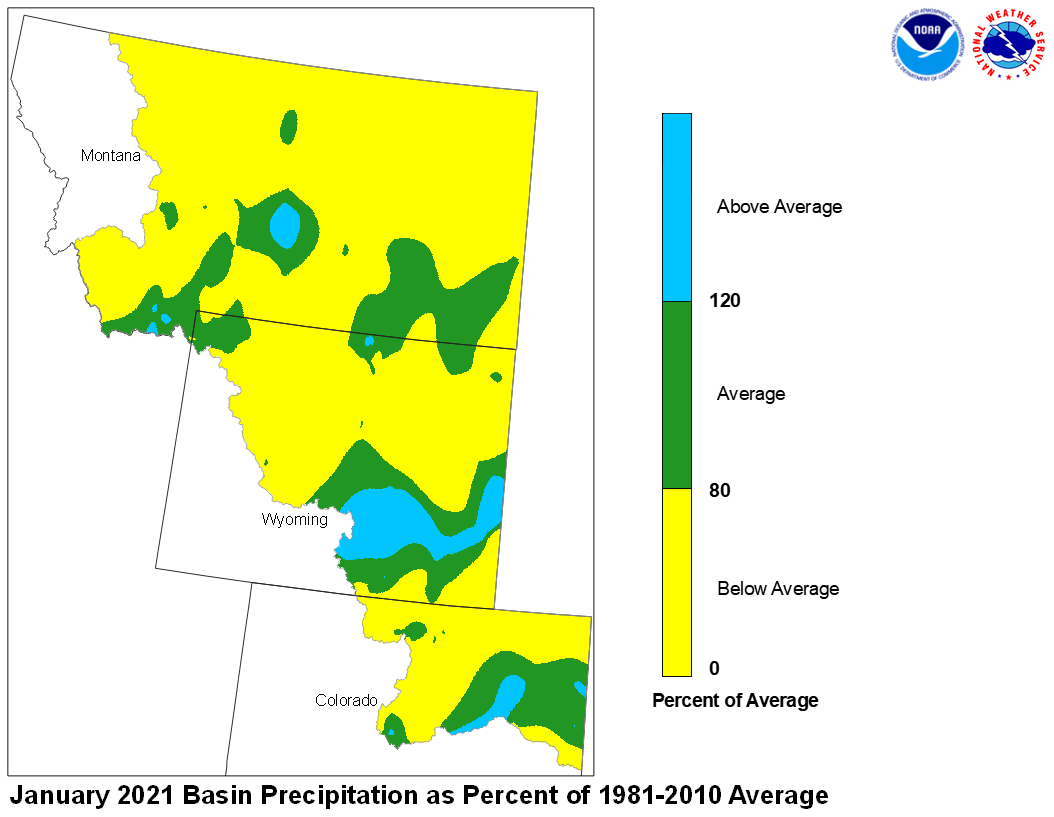
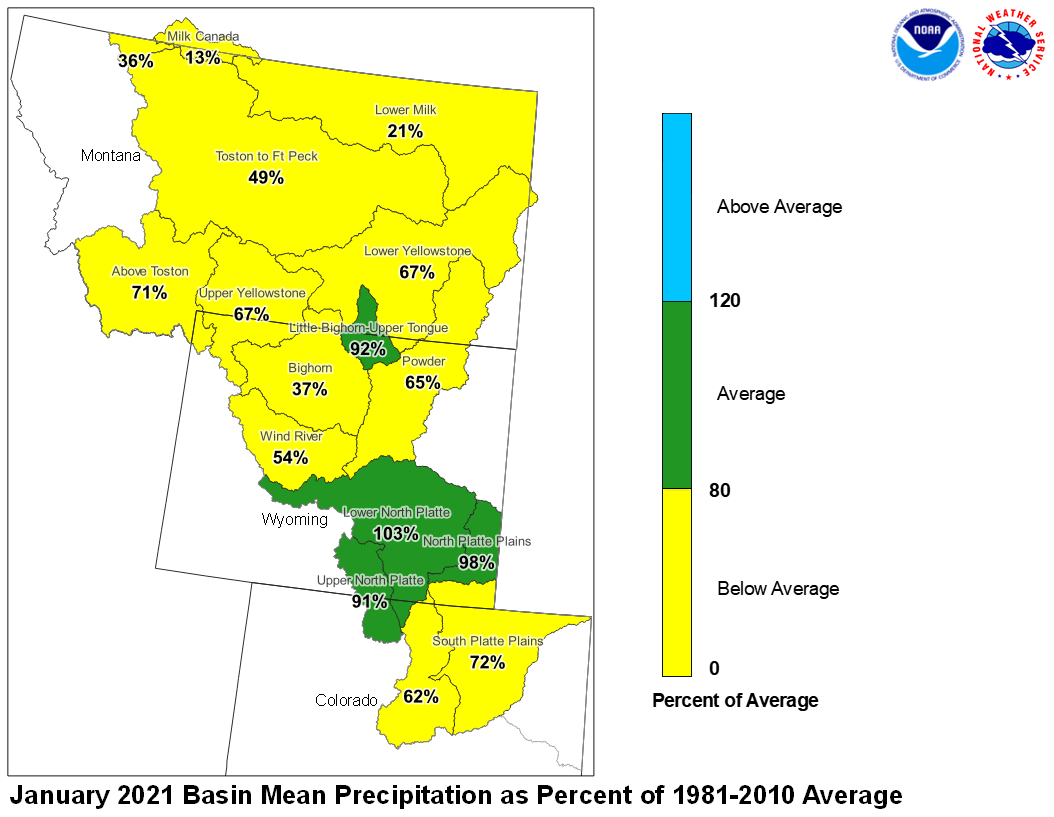
January precipitation across the Upper Missouri Basin was below average.
Basin precipitation summaries for the Missouri Basin include: Milk St. Mary,
36 percent; Milk Canada, 13 percent; Lower Milk, 21 percent; above Toston,
71 percent; Toston to Ft. Peck, 49 percent.

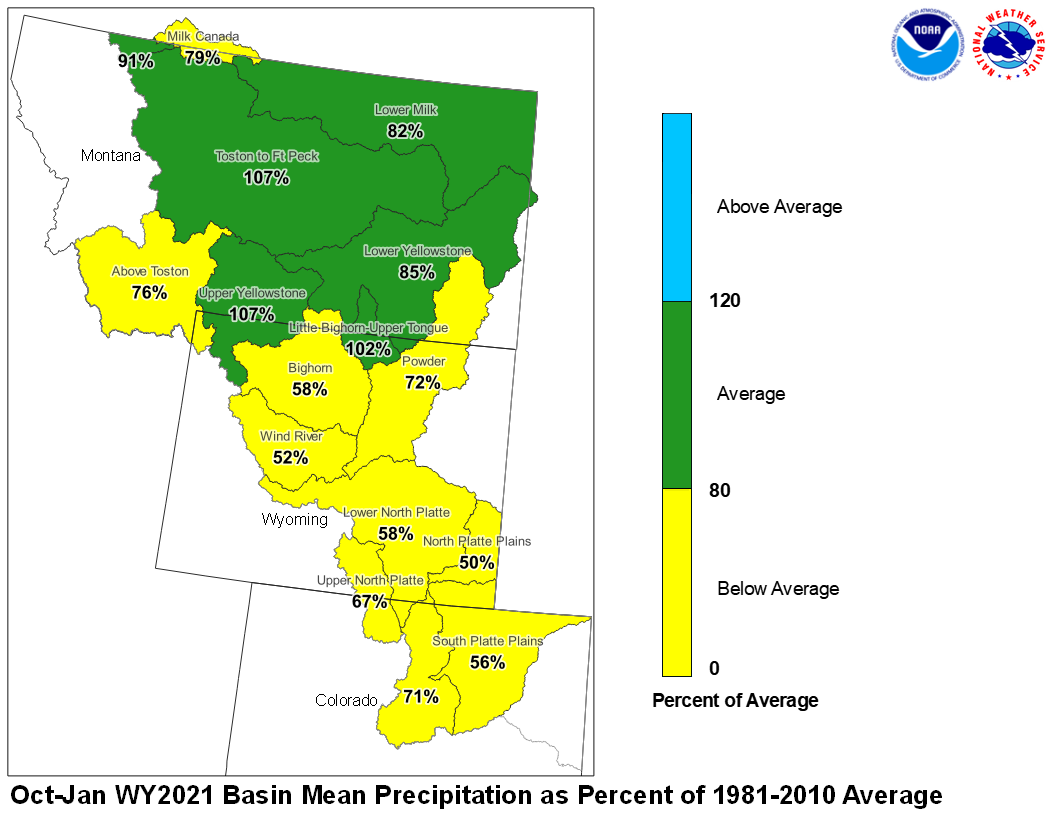
January 2021 Upper Missouri Mean Precip Oct-Jan WY2021 Upper Missouri Mean Precip
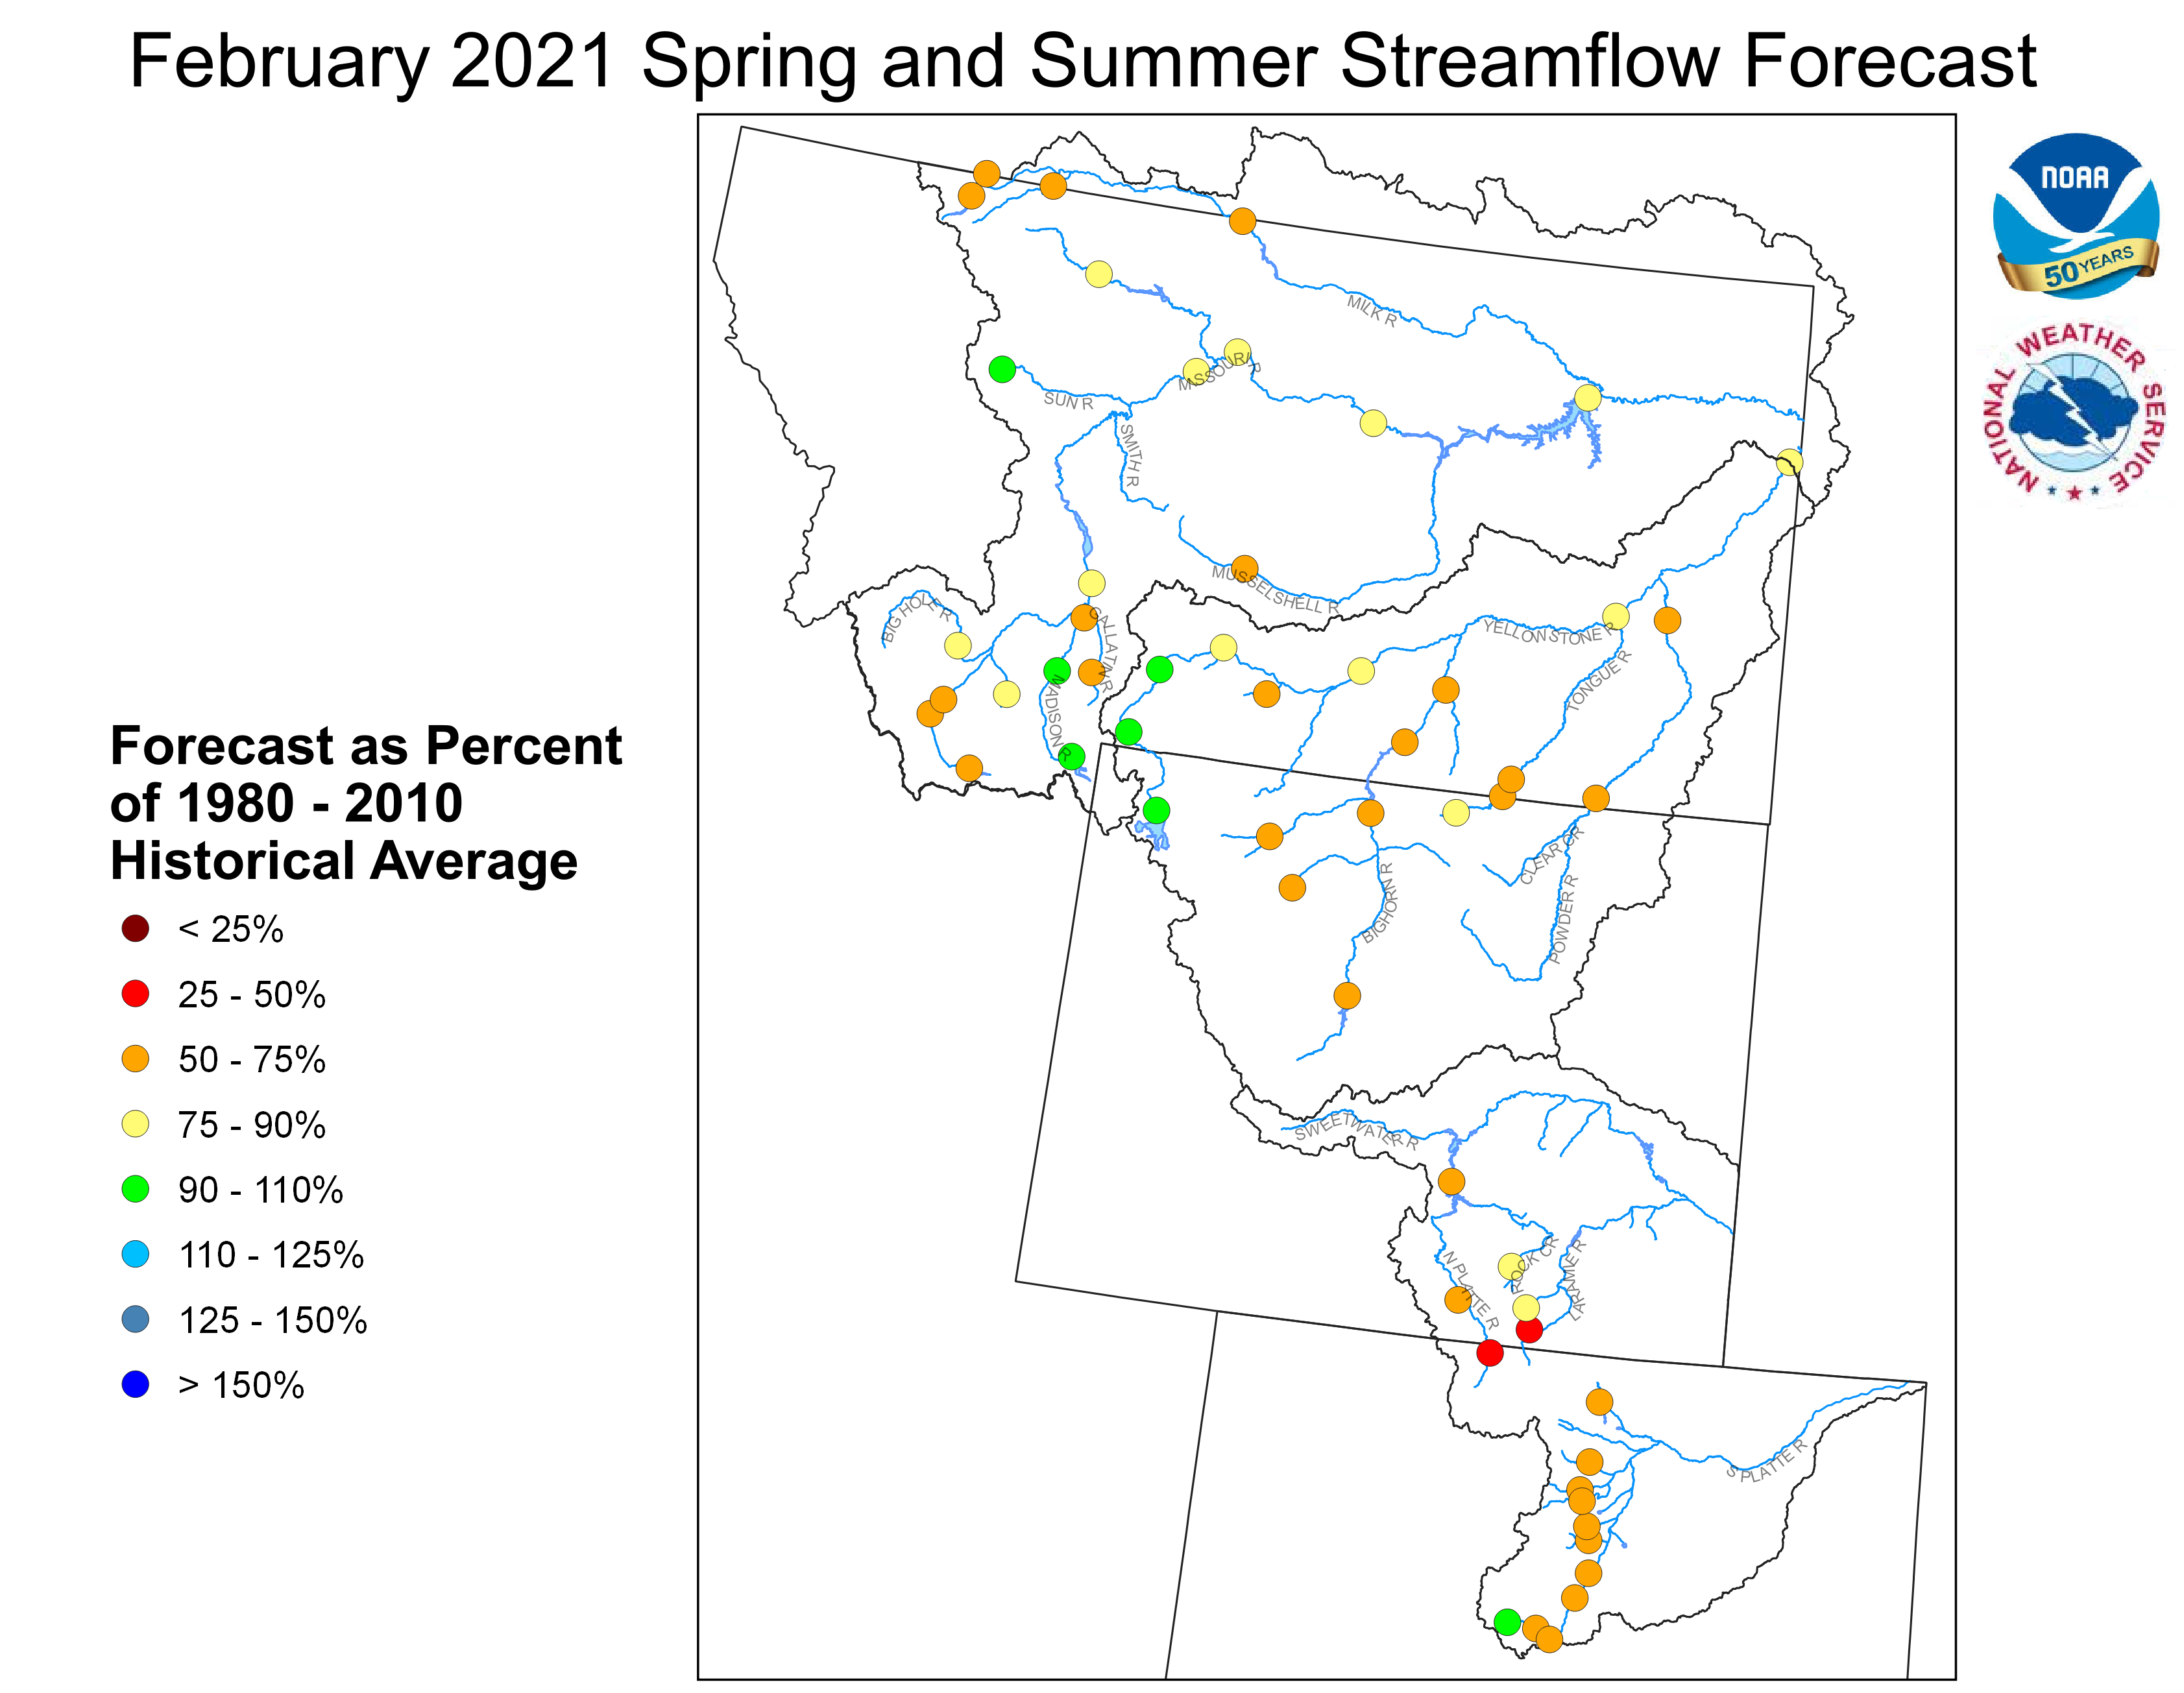
Stream flow in the Upper Missouri Basin is forecast to be
below average during the upcoming Spring and Summer.
The St. Mary River is forecast to have 72 percent of average
April-September flows. Runoff is expected to range around
87 percent of average for the Missouri Basin above Fort Peck,
Montana.
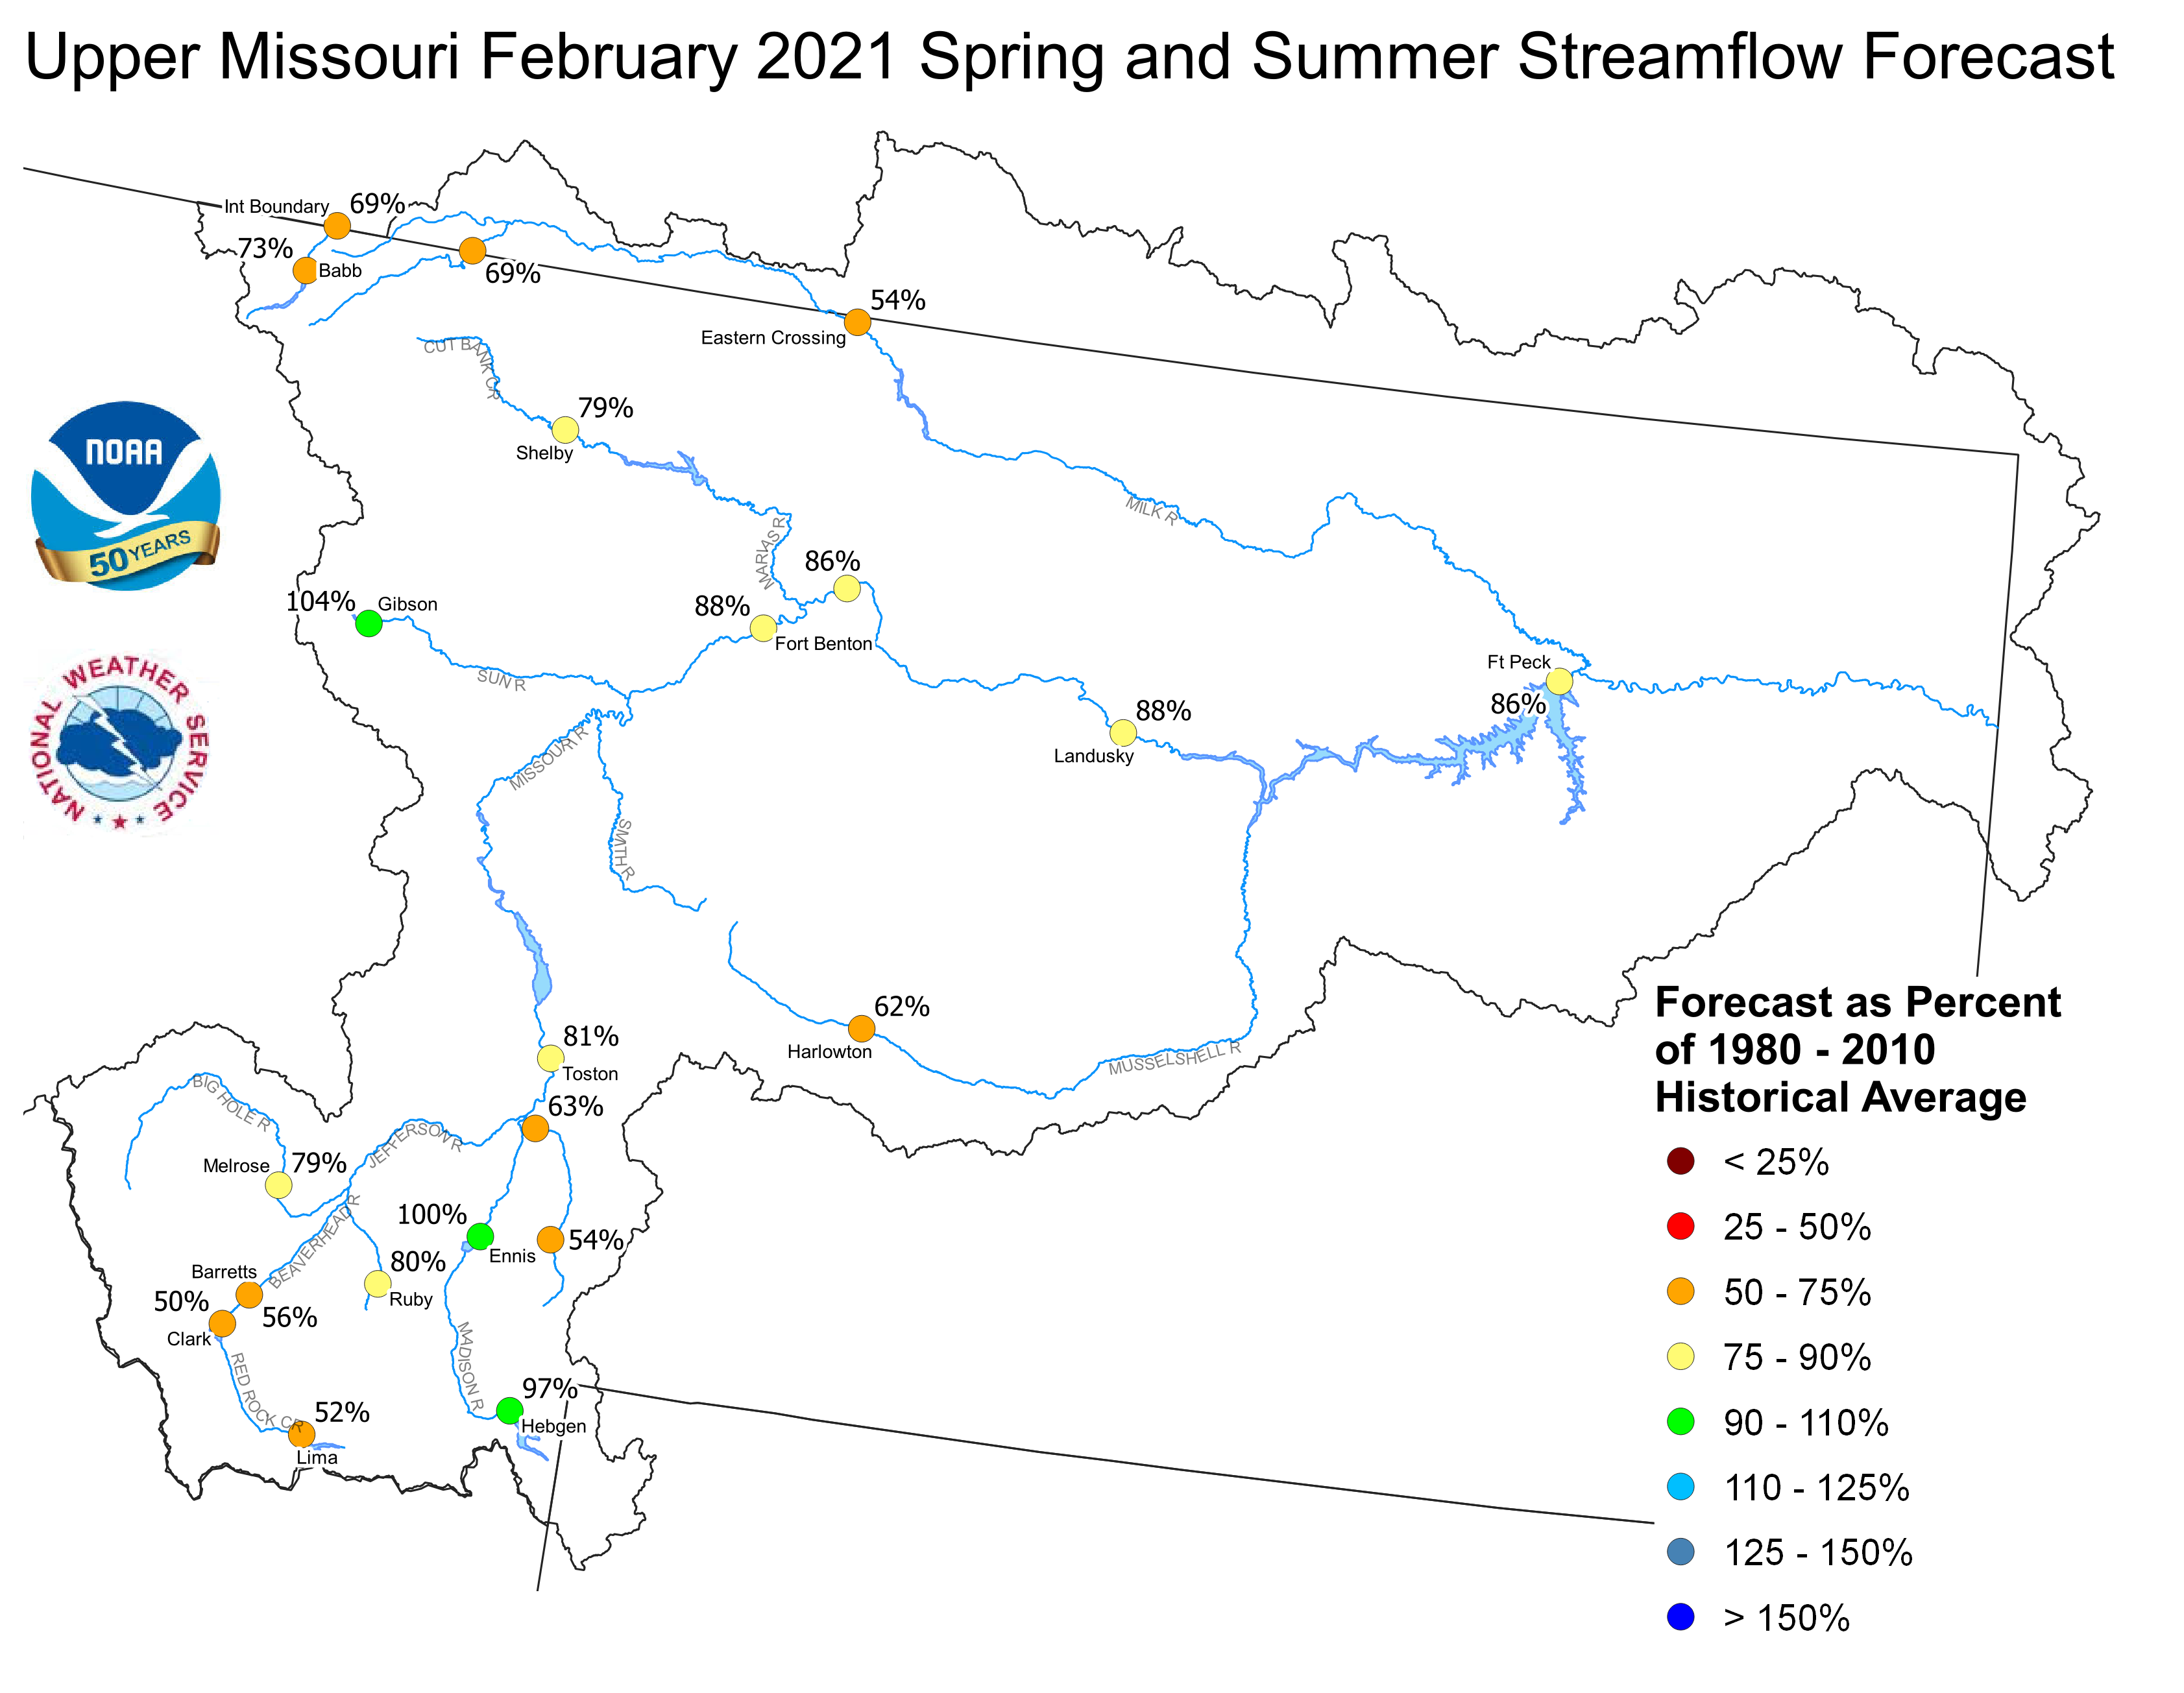
Upper Missouri February 1, 2021 Spring and Summer Streamflow Forecasts
Of the four major irrigation reservoirs in Montana; Lima
Reservoir had 136 percent average storage, Clark Canyon was
holding 105 percent of average water, Gibson Reservoir had 74
percent of average stored water, and Fresno Reservoir had
71 percent of average stored water.
Yellowstone Basin
The high elevation snow pack in the Yellowstone Basin was below average
on February 1. The snow pack in the Upper Yellowstone Basin was 89 percent
of average. The snow packs in the Wind, Bighorn, and Shoshone Basins were 67,
76, and 87 percent of average, respectively. The snow packs in the Tongue
and Powder basins were 88 and 74 percent of average, respectively.
Precipitation during January was below average. The upper Yellowstone
River Basin received 67 percent of average precipitation while the
Lower Yellowstone River Basin reported 67 percent of average. The
Bighorn Basin received 37 percent of average precipitation while the
Wind River Basin received 54 percent of average. The Little Bighorn -
Upper Tongue Basin received 92 percent of average and the Powder River
had 66 percent of average precipitation.


January 2021 Yellowstone Mean Precip Oct-Jan WY2021 Yellowstone Mean Precip
Forecast stream flow in the Yellowstone Basin is below average
for the upcoming Spring and Summer. Stream flow for the
Yellowstone River above Sidney, Montana is forecast to be about
89 percent of average. Flow in the Tongue Basin is expected to be
75 percent of average. Flows in the Powder River are expected
to be about 53 percent of average.
Monthend storage at Boysen Reservoir was 102 percent of average.
Stored water in Buffalo Bill Reservoir was 127 percent of average.
Monthend storage was 103 percent of average at Bighorn Reservoir.
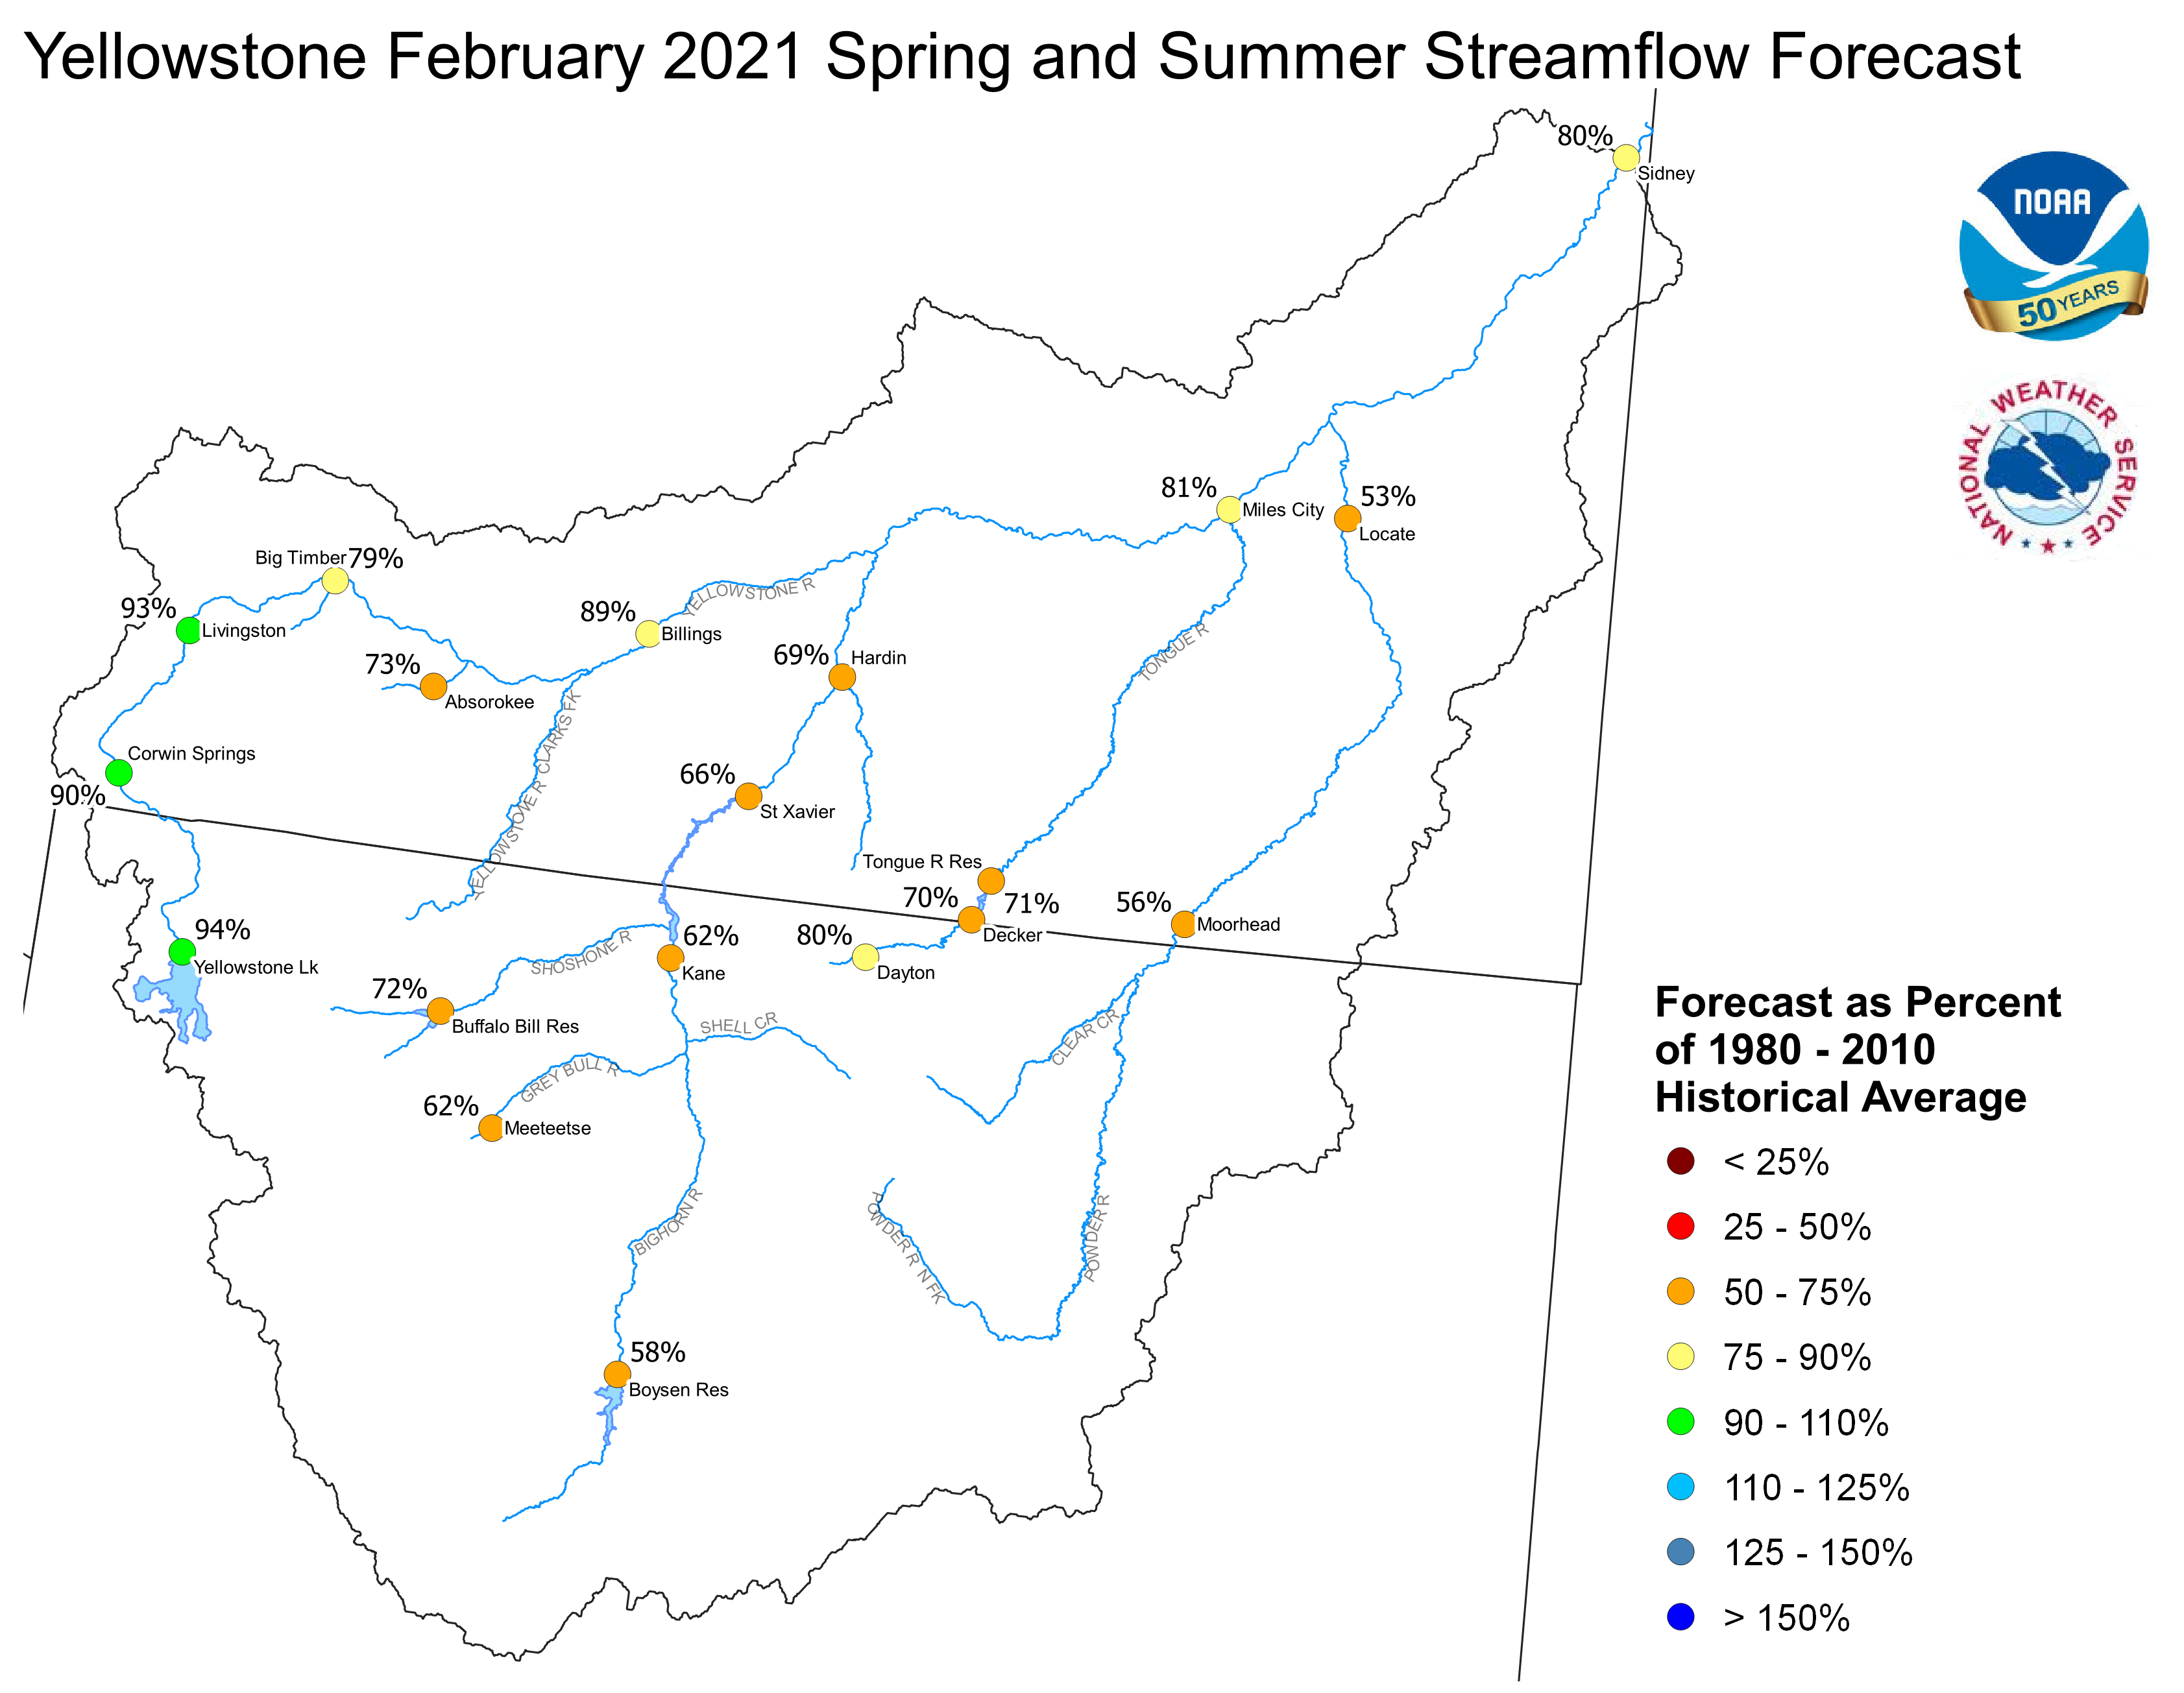
Yellowstone February 1, 2021 Spring and Summer Streamflow Forecasts
Platte Basin
The high elevation snow pack in the Upper North Platte Basin was
77 percent of average on February 1. The snow pack in the North Platte
Basin below Seminoe Reservoir was 71 percent of average. The snow
pack in the South Platte Basin was 75 percent of average.
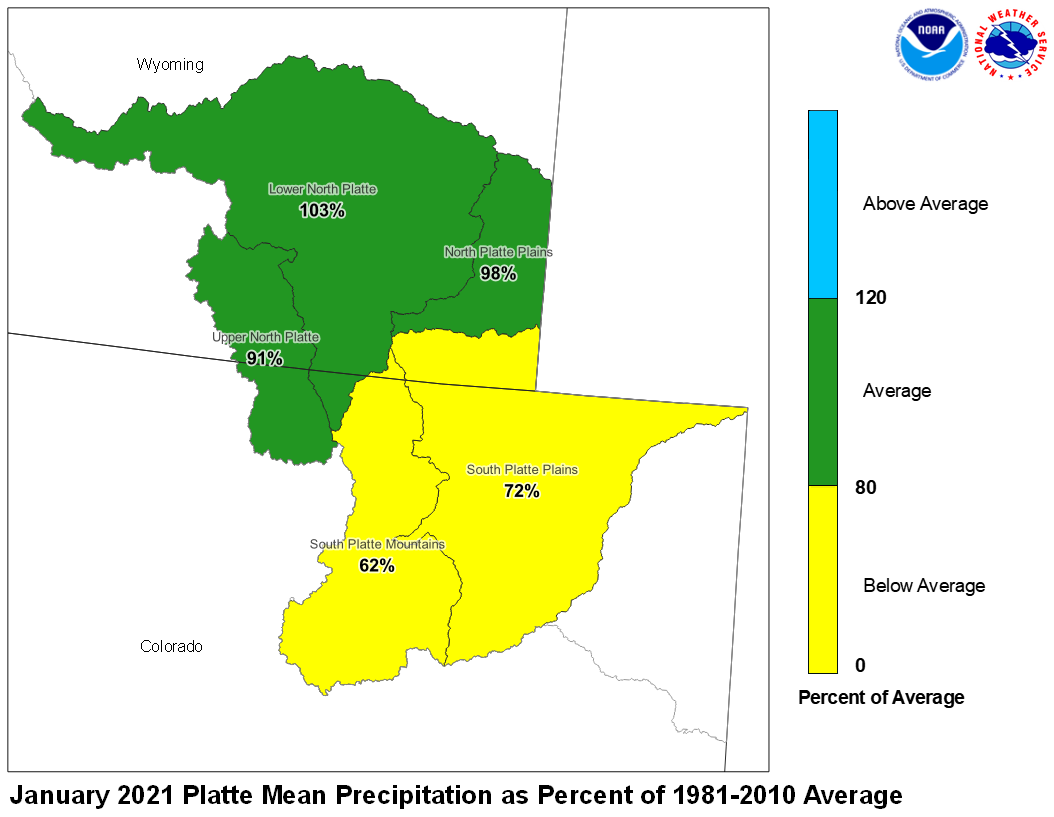
Precipitation during January in the Upper North Platte Basin was 91
percent of average. In the Lower North Platte Basin, precipitation
was 103 percent of average. The North Platte Plains below Guernsy
Reservoir had 98 percent. The South Platte Mountains had 62
percent whereas the Plains had 72 percent of average December
precipitation.
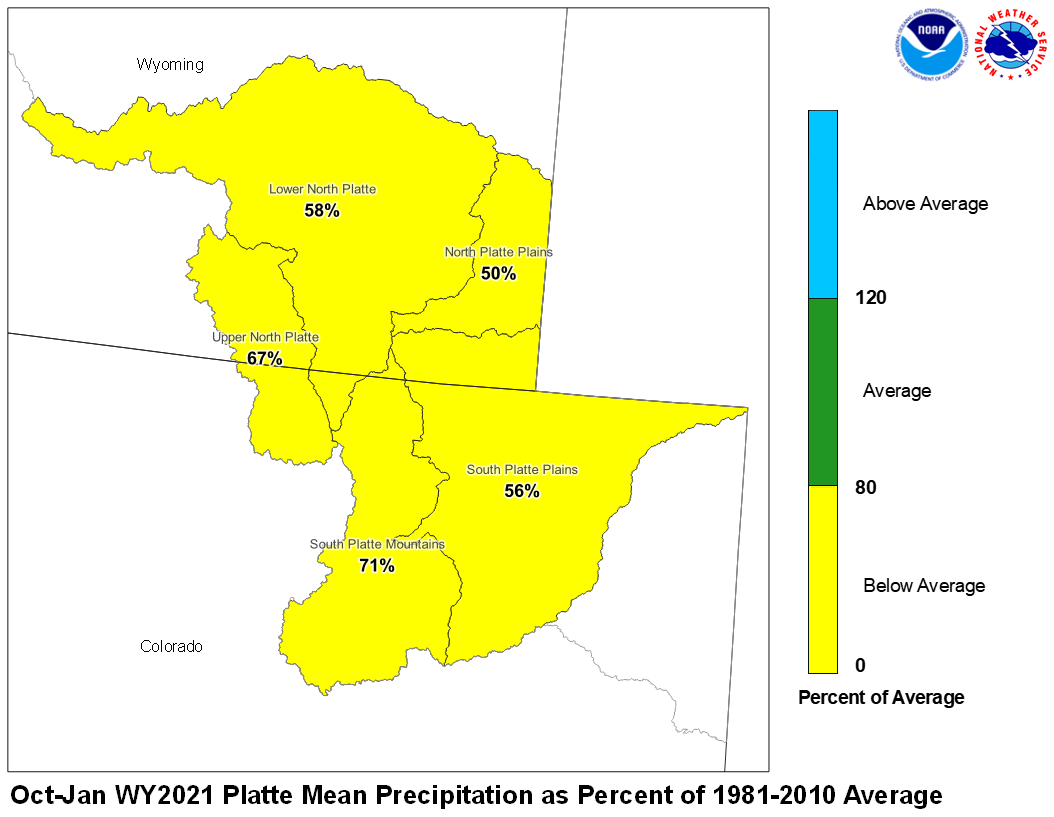
DecemberJanuary 2021 Platte Mean Precip Oct-Jan WY2021 Platte Mean Precip
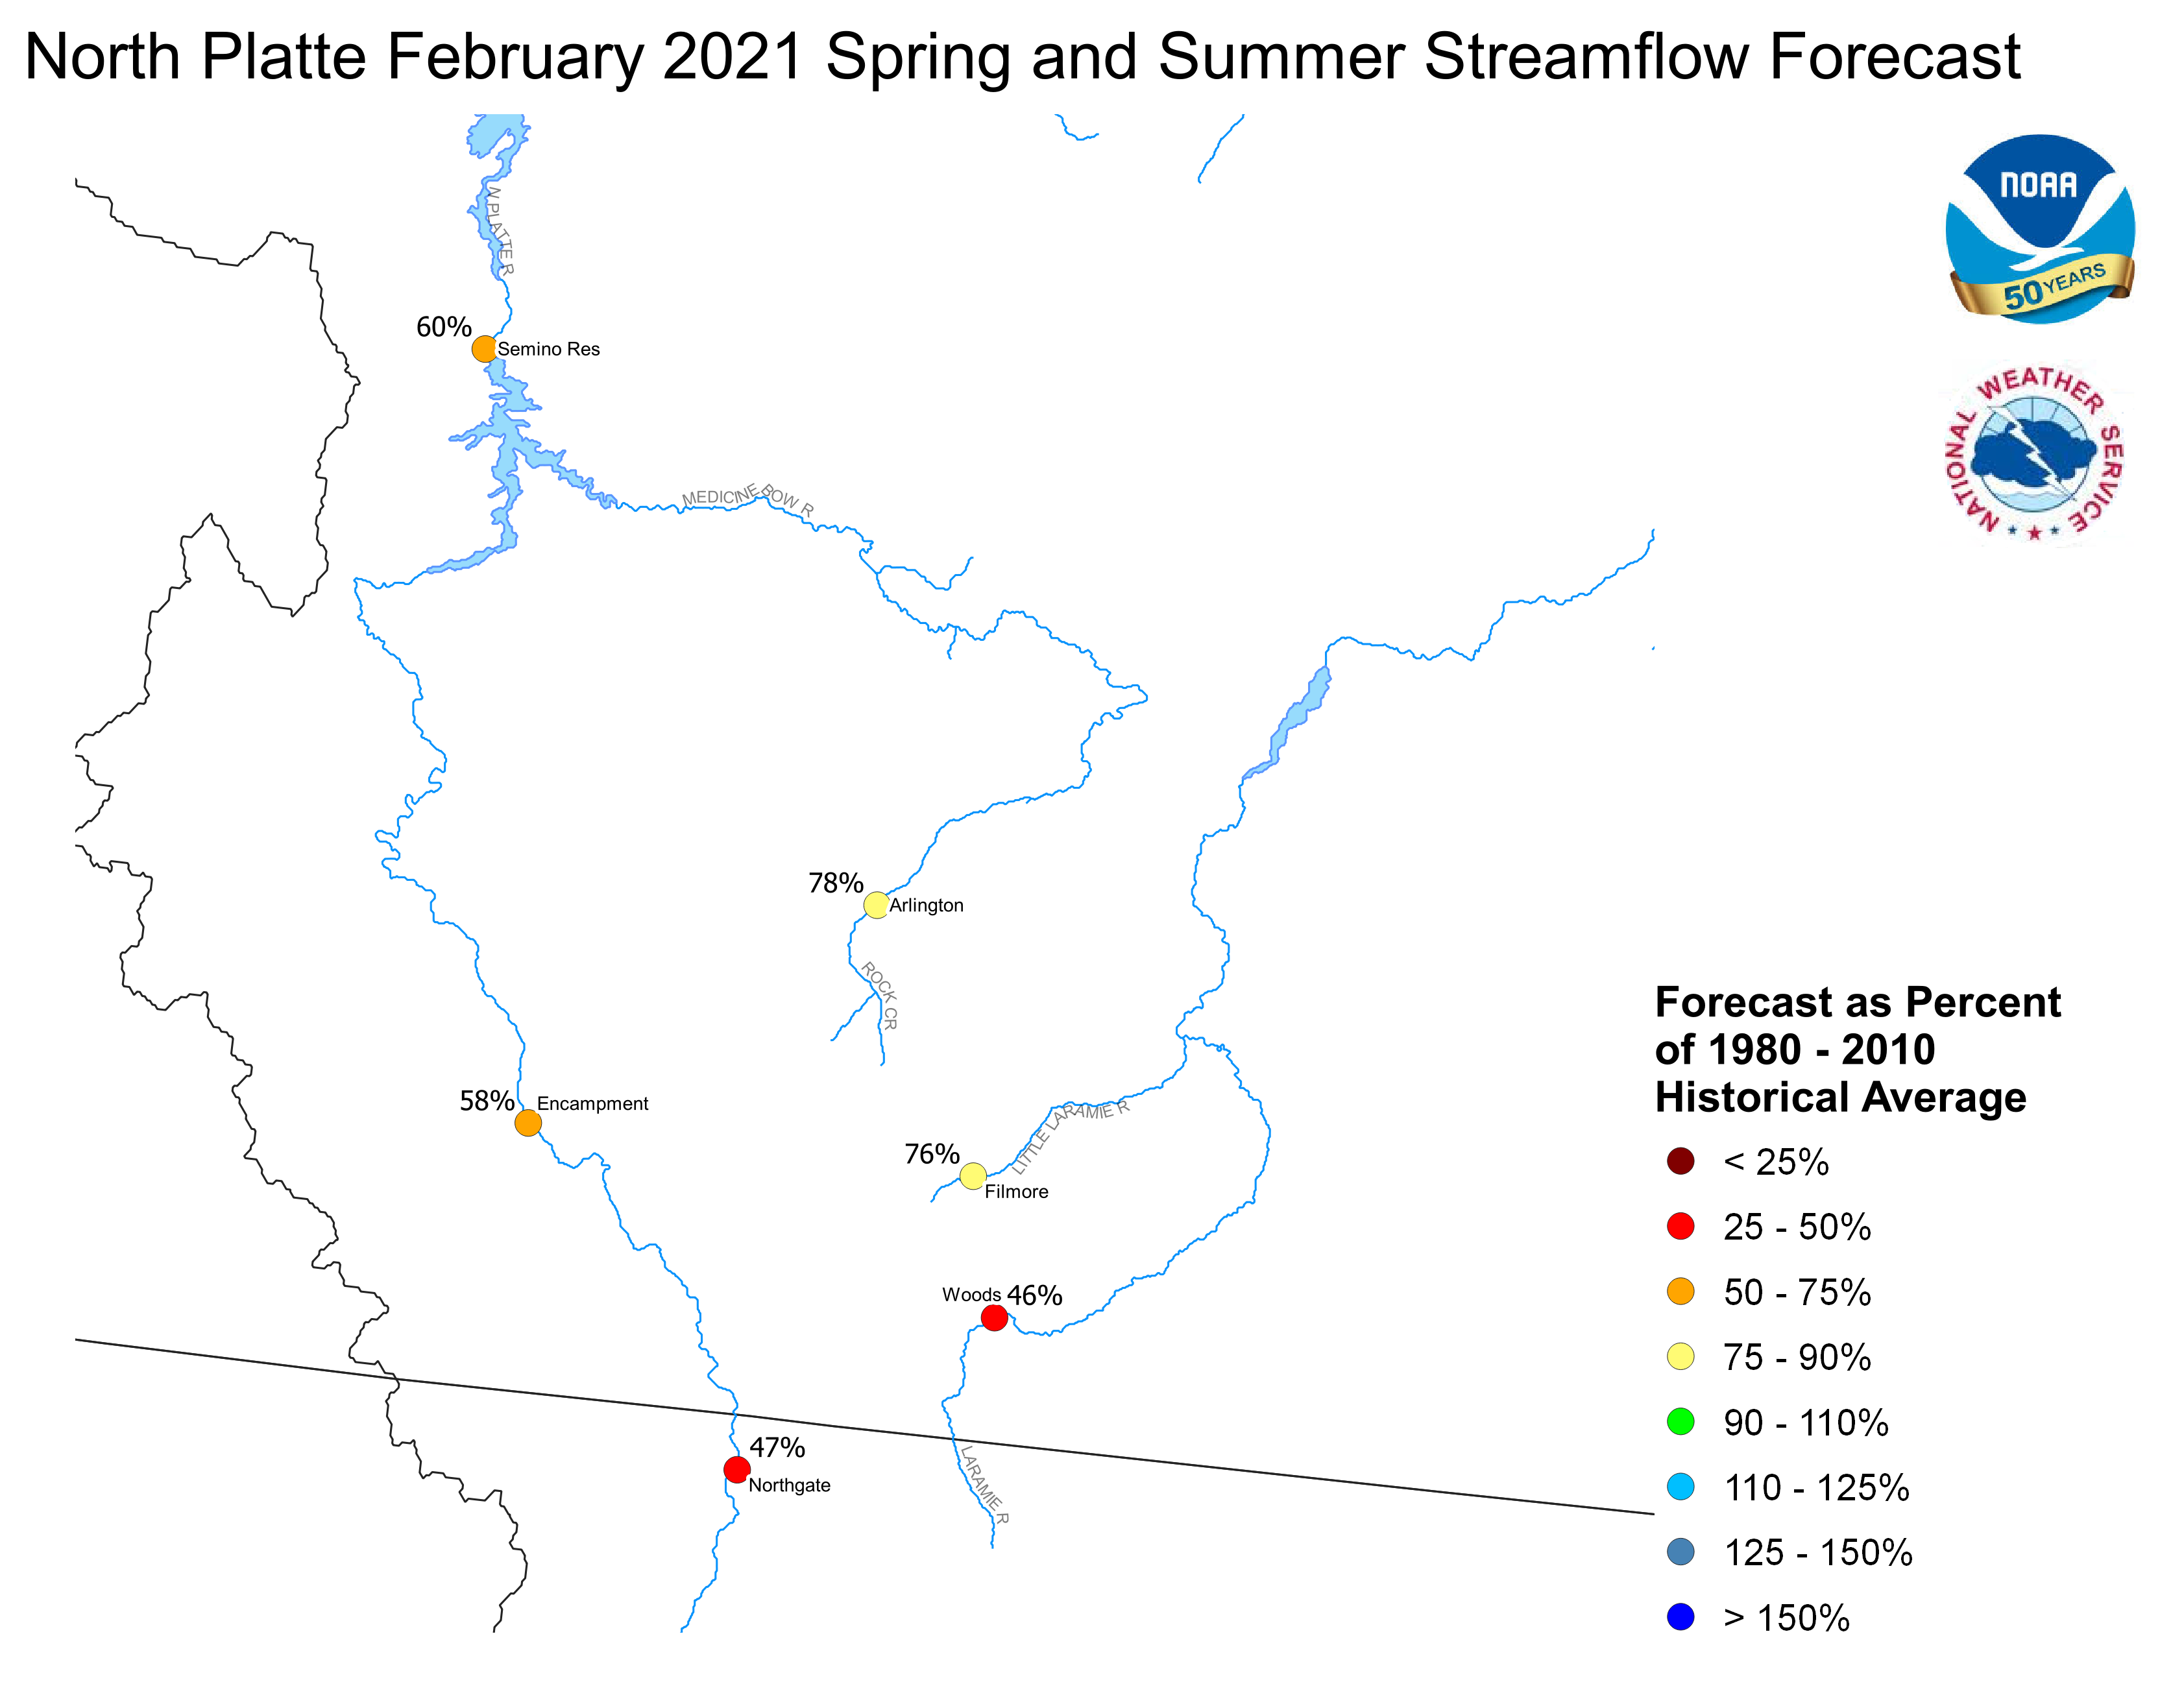
Stream flow in the Platte Basin is forecast to be below
average during the upcoming Spring and Summer. Runoff
for streams above Seminoe Reservoir are expected to be
about 65 percent of average. Streams in the South Platte
Basin above South Platte, Colorado can expect 65 percent
of average flow. For the remainder of the South Platte
basin, flows are expected near 67 percent.
Stored water in the South Platte Basin was 90 percent of average
on February 1.
North Platte Streamflow Fcst South Platte Streamflow Fcst
FGUS63 KKRF 021553
ESPKRF
WATER SUPPLY FORECAST
NWS MISSOURI BASIN RIVER FORECAST CENTER
PLEASANT HILL MISSOURI

0931 AM CST TUESDAY FEBRUARY 02, 2021

DATA CURRENT AS OF: FEBRUARY 01, 2021

MISSOURI/YELLOWSTONE/PLATTE RIVER BASIN FORECASTS


                                          50%   %   10%   90%   AVG
FORECAST POINT                   PERIOD  (KAF) AVG (KAF) (KAF) (KAF)
--------------------------------------------------------------------

Boysen Resvr Inflow              Apr-Sep  661   58  1233  409   1140
 SBDW4N

Bighorn R at Kane                Apr-Sep 1054   62  1762  715   1690
 LVEW4N

Greybull R at Meeteetse          Apr-Sep  111   62   217   54    177
 MEEW4N

Buffalo Bill Resvr Inflow        Apr-Sep  548   72   756  424    765
 CDYW4N

St. Mary R nr Babb               Apr-Sep  392   73   481  340    535
 SMYM8N

St. Mary R at Intl Boundary      Apr-Sep  457   69   578  393    660
 SMBM8N

Milk R nr Western Crossing       Apr-Sep   28   69    57   13     41
 PDBM8N

Milk R nr Eastern Crossing       Apr-Sep   44   54   107   21     81
 ERNM8N

North Platte R nr Northgate      Apr-Sep  141   47   280   62    300
 NGTC2

Encampment R nr Encampment       Apr-Sep   83   56   124   47    150
 ECRW4

Encampment R nr Encampment       Apr-Sep   92   58   132   57    160
 ECRW4N

Rock Cr nr Arlington             Apr-Sep   41   79    58   29     52
 KCRW4

Rock Cr nr Arlington             Apr-Sep   42   78    59   30     53
 KCRW4N

Seminoe Resvr Inflow             Apr-Sep  433   54   769  187    805
 SETW4

Seminoe Resvr Inflow             Apr-Sep  576   60   914  305    955
 SETW4N

Laramie R nr Woods Landing       Apr-Sep   31   29    87   14    108
 WODW4

Laramie R nr Woods Landing       Apr-Sep   66   46   122   40    142
 WODW4N

Little Laramie R nr Filmore      Apr-Sep   41   75    71   29     55
 SMTW4

Little Laramie R nr Filmore      Apr-Sep   43   76    73   31     57
 SMTW4N

Antero Resvr Inflow              Apr-Sep   16   94    24   11     17
 ANRC2N

Spinney Mountain Resvr Inflow    Apr-Sep   37   66    65   25     56
 SPYC2N

Elevenmile Canyon Resvr Inflow   Apr-Sep   40   67    73   27     60
 EVNC2N

Cheesman Lk Inflow               Apr-Sep   72   63   140   47    114
 CHEC2N

S Platte R at S Platte           Apr-Sep  136   66   244   87    205
 SPTC2N

Bear Cr at Morrison              Apr-Sep   12   56    26    6     21
 MRRC2N

Clear Cr at Golden               Apr-Sep   61   53   106   36    117
 GLDC2N

St. Vrain Cr at Lyons            Apr-Sep   69   62   106   44    111
 LNSC2N

Boulder Cr nr Orodell            Apr-Sep   35   66    51   23     52
 OROC2N

S Boulder Cr nr Eldorado Sprgs   Apr-Sep   21   51    35   10     40
 BELC2N

Cache La Poudre at Canyon Mouth  Apr-Sep  148   71   264   80    210
 FTDC2N

Lima Resvr Inflow                Apr-Sep   40   52    70   26     78
 LRRM8N

Clark Canyon Resvr Inflow        Apr-Sep   79   50   125   52    159
 CLKM8N

Beaverhead R at Barretts         Apr-Sep  108   56   154   76    194
 BARM8N

Ruby R Resvr Inflow              Apr-Sep   77   80    97   58     97
 ALRM8N

Big Hole R nr Melrose            Apr-Sep  390   70   553  258    560
 MLRM8

Big Hole R nr Melrose            Apr-Sep  448   79   610  315    570
 MLRM8N

Hebgen Resvr Inflow              Apr-Sep  416   97   529  347    430
 HBDM8N

Ennis Resvr Inflow               Apr-Sep  744  100   875  612    745
 ELMM8N

Gallatin R nr Gateway            Apr-Sep  245   54   319  188    455
 GLGM8

Gallatin R nr Gateway            Apr-Sep  245   54   319  188    455
 GLGM8N

Gallatin R at Logan              Apr-Sep  247   49   366  157    505
 LOGM8

Gallatin R at Logan              Apr-Sep  378   63   497  278    595
 LOGM8N

Missouri R at Toston             Apr-Sep 2034   81  2603 1561   2510
 TOSM8N

Missouri R at Fort Benton        Apr-Sep 3254   88  4085 2510   3690
 FBNM8N

Missouri R nr Virgelle           Apr-Sep 3687   86  4738 2906   4280
 VRGM8N

Missouri R nr Landusky           Apr-Sep 3929   88  5111 3128   4490
 LDKM8N

Missouri R below Fort Peck Dam   Apr-Sep 4061   86  5343 3211   4730
 FPKM8N

Gibson Resvr Inflow              Apr-Sep  414  104   607  327    400
 AGSM8N

Marias R nr Shelby               Apr-Sep  355   79   560  258    450
 SHLM8N

Musselshell R at Harlowton       Apr-Sep   64   62   109   40    104
 HLWM8N

Yellowstone R at Yellowstone Lk  Apr-Sep  582   73   722  460    795
 YLOW4

Yellowstone R at Yellowstone Lk  Apr-Sep  787   94   938  624    840
 YLOW4N

Yellowstone R at Corwin Sprgs    Apr-Sep 1495   80  1800 1209   1880
 CORM8

Yellowstone R at Corwin Sprgs    Apr-Sep 1782   90  2119 1408   1980
 CORM8N

Yellowstone R at Livingston      Apr-Sep 1781   84  2109 1437   2130
 LIVM8

Yellowstone R at Livingston      Apr-Sep 2144   93  2495 1716   2310
 LIVM8N

Yellowstone R at Billings        Apr-Sep 2751   74  3246 2084   3730
 BILM8

Yellowstone R at Billings        Apr-Sep 3771   89  4300 3051   4260
 BILM8N

Yellowstone R at Miles City      Apr-Sep 5855   81  7125 4533   7250
 MILM8N

Yellowstone R at Sidney          Apr-Sep 6058   80  7366 4638   7540
 SIDM8N

Boulder R at Big Timber          Apr-Sep  216   72   256  165    300
 BTMM8

Boulder R at Big Timber          Apr-Sep  256   79   295  205    325
 BTMM8N

Stillwater R nr Absarokee        Apr-Sep  345   68   414  279    505
 SRAM8

Stillwater R nr Absarokee        Apr-Sep  403   73   472  335    550
 SRAM8N

Clks Fk Yellowstone R nr Belfry  Apr-Sep  416   76   532  325    550
 BFYM8

Clks Fk Yellowstone R nr Belfry  Apr-Sep  489   82   603  396    600
 BFYM8N

Bighorn R nr St. Xavier          Apr-Sep 1691   66  2628 1151   2550
 STXM8N

Little Bighorn R nr Hardin       Apr-Sep   71   69   108   50    103
 HRDM8N

Tongue R nr Dayton               Apr-Sep   67   80    83   51     83
 DAYW4N

Tongue R nr Decker               Apr-Sep  151   70   210  102    215
 DSLM8N

Tongue R Resvr Inflow            Apr-Sep  152   71   217  103    215
 DKRM8N

Powder R at Moorhead             Apr-Sep  123   56   243   66    220
 MHDM8N

Powder R nr Locate               Apr-Sep  131   53   306   72    245
 LOCM8N


Locations with an `N` suffix indicate natural flows excluding
stream augmentations.

KAF: Thousands of Acre-feet

%AVG: Current 50%/AVG

AVG: Average(50%) seasonal runoff voulme as simulated by the river
forecast model considering acontinuous simulation of the basin
response to historic climate data (observed precipitation and
temperatures) over the period of 1981-2010.

The 50%, 10% and 90% columns indicate the probability that the
actual volume will exceed the forecast for the valid time perion
for more information, please visit: www.weather.gov/mbrfc/water

$$


