River Forecast Verification - LUSN1
Lincoln%2C+NE - Salt+Creek
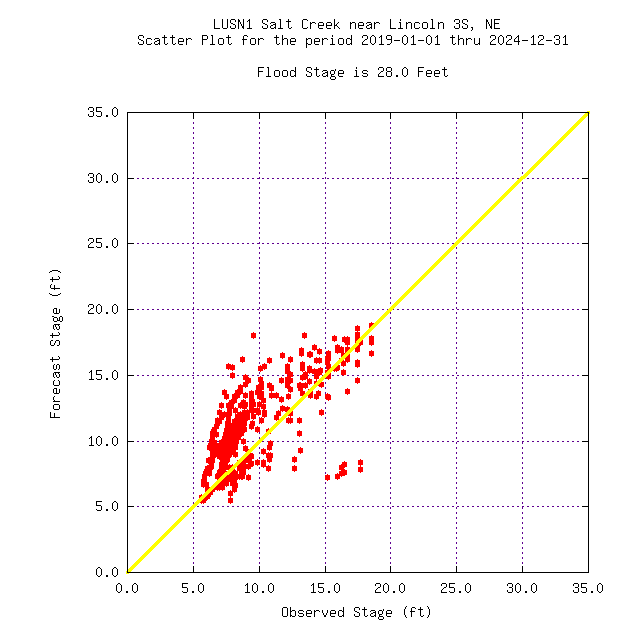
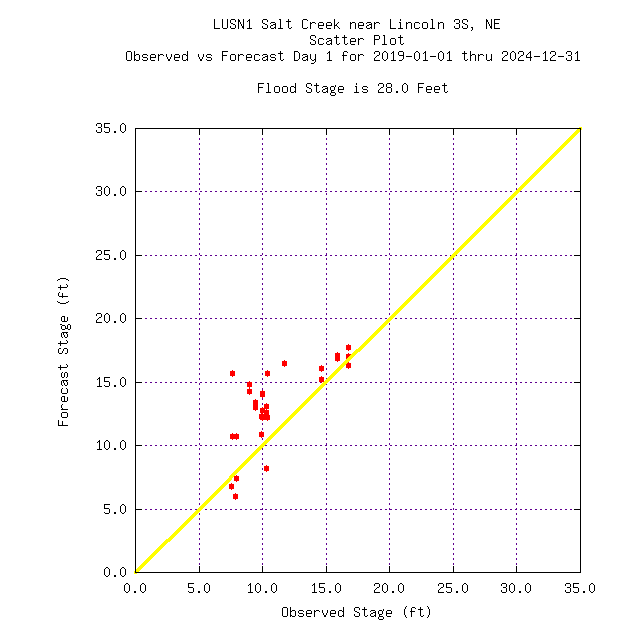
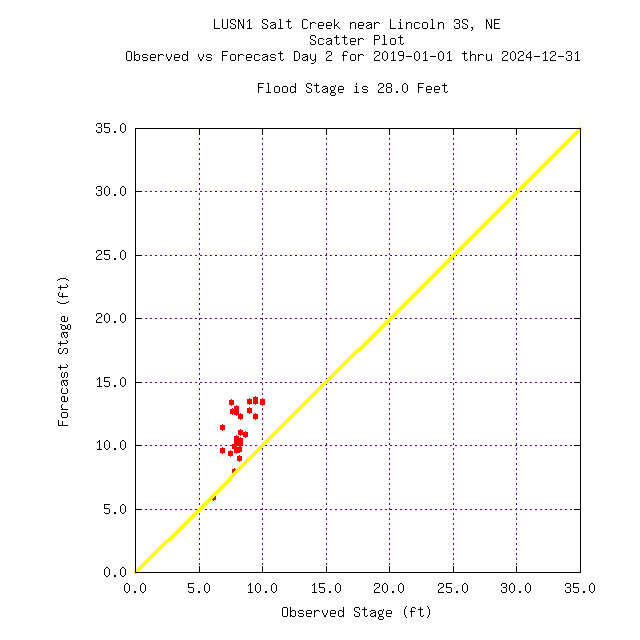
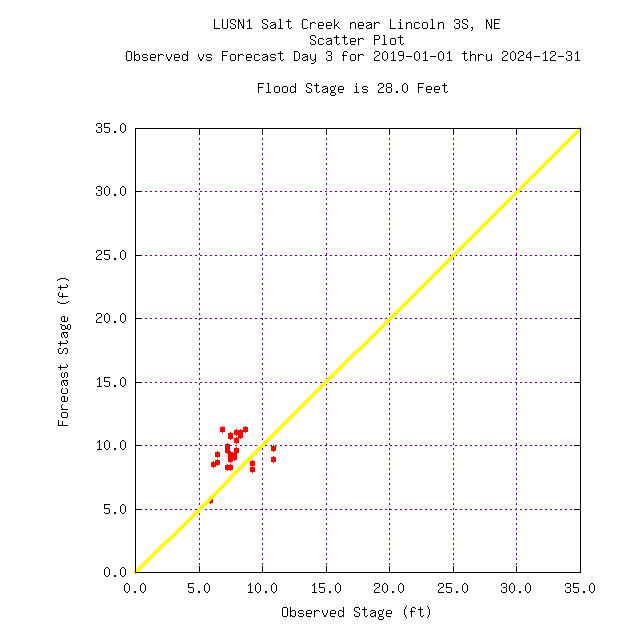
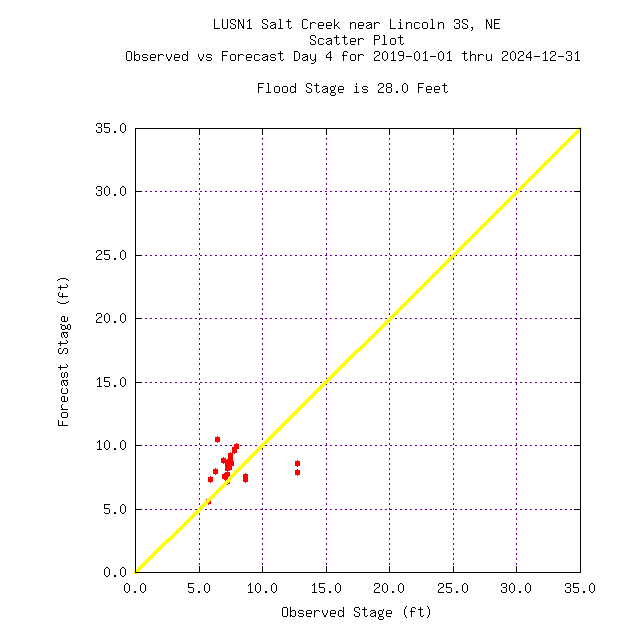
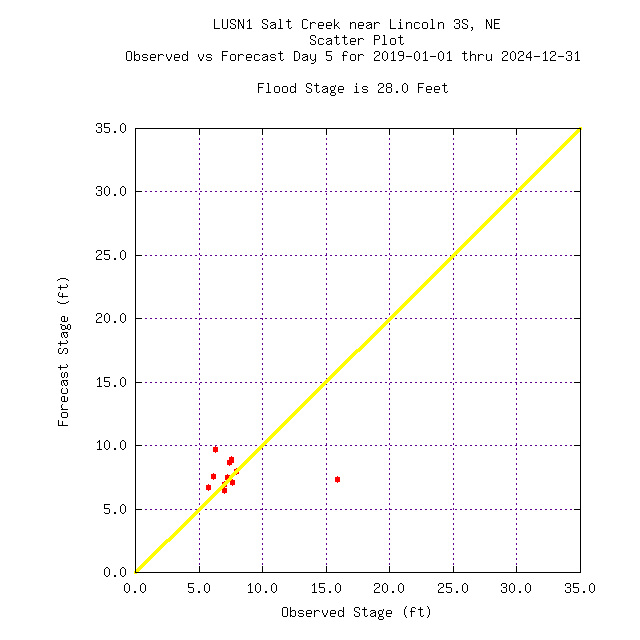
The scatterplot view gives a general overview of the forecast and observed data. Under forecasting is indicated blow the diagonal while over forecasting is above the diagonal. Ideally, the closer the values to the diagonal, the better the forecasts.
Day 1 | Day 2 | Day 3 |
Day 4 | Day 5 |
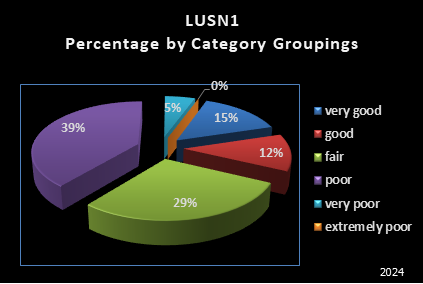
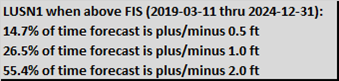
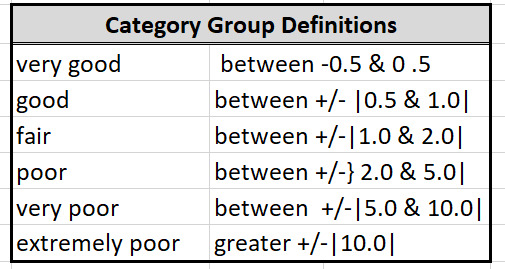
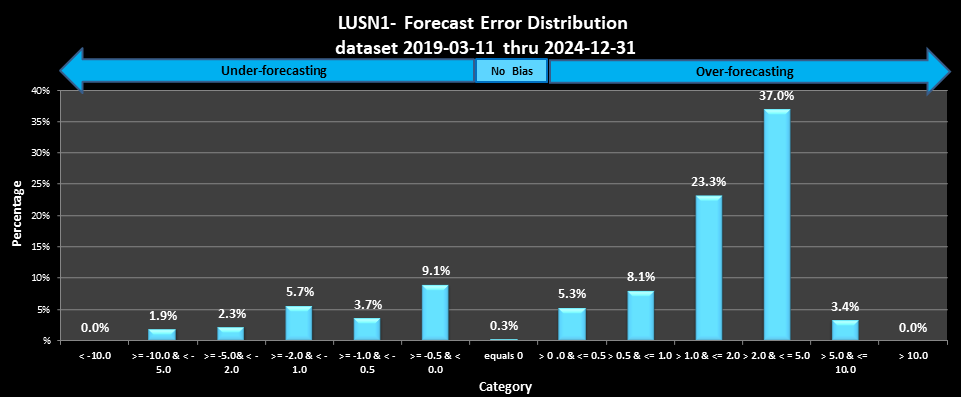
The information in this section provides the user with an idea of the quality of a forecast based on the forecast error and bias of past forecasts. Three pieces of information are proved 1) forecast quality pie chart, 2) a summary of forecast error data, and 3) a forecast error distribution bar chart. The pie chart gives a qualitative general overview of the forecast quality. The summary table provides information on forecast skill, based on the size of the errors and how often forecast falls with in a range. The forecast error distribution bar chart shows the under- and over-forecasting basis. Ideally, one would want the forecast errors to always fall within the +/- 0.5 range.
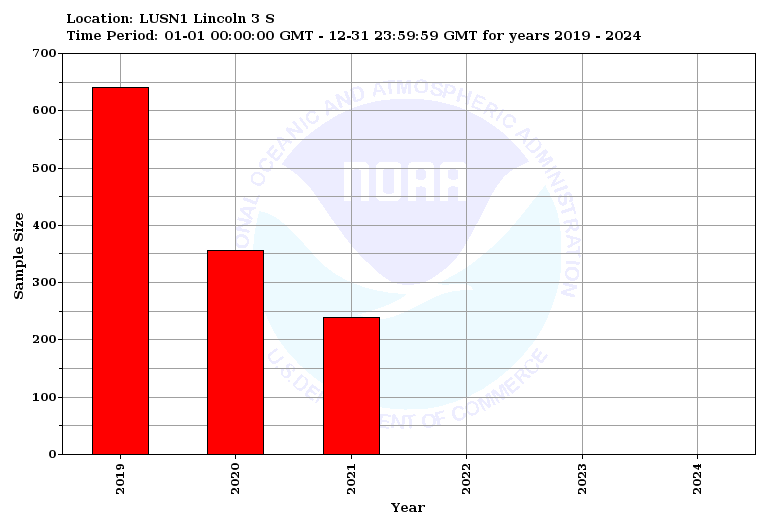
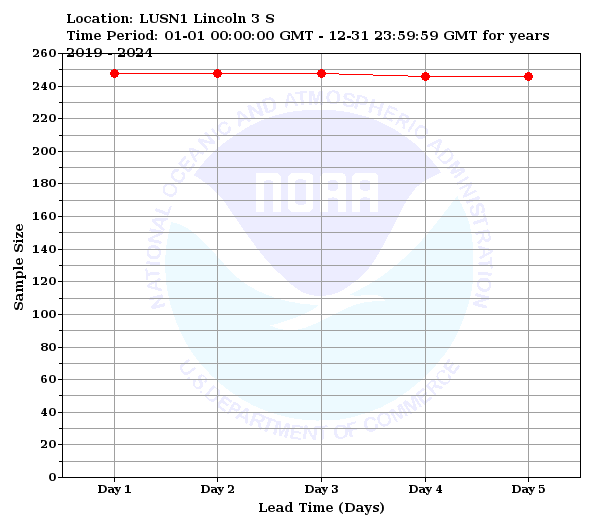
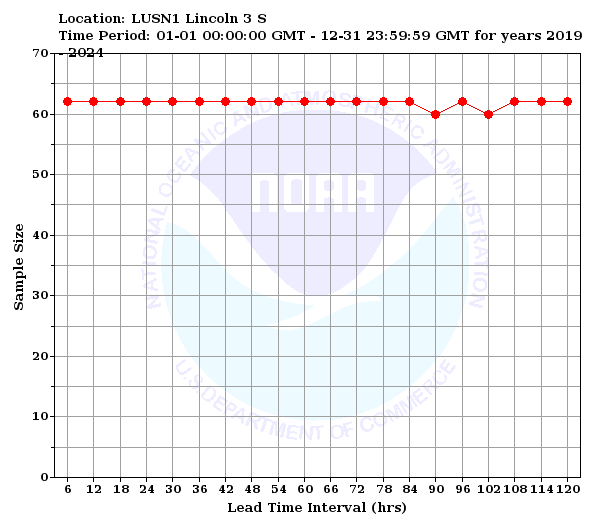
The sample size displays the number of forecast-observed pairs used in the verification calculations.
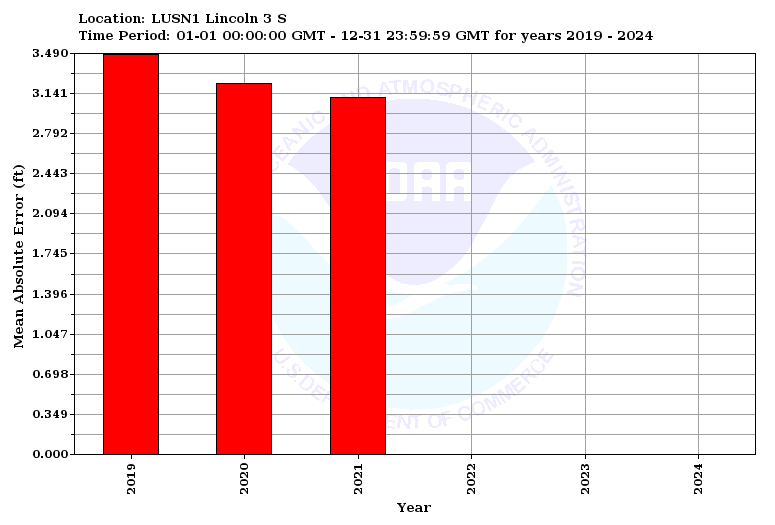
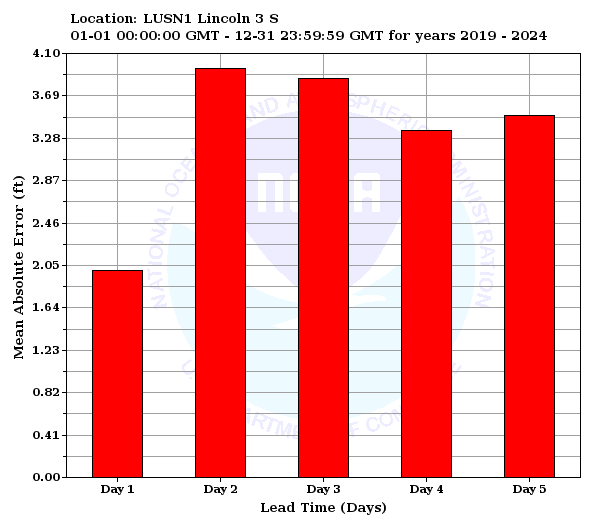
Mean Absolute Error is the average error between the absolute value of the forecast and observed value for each pair. The closer the value is to zero, the better the forecast.

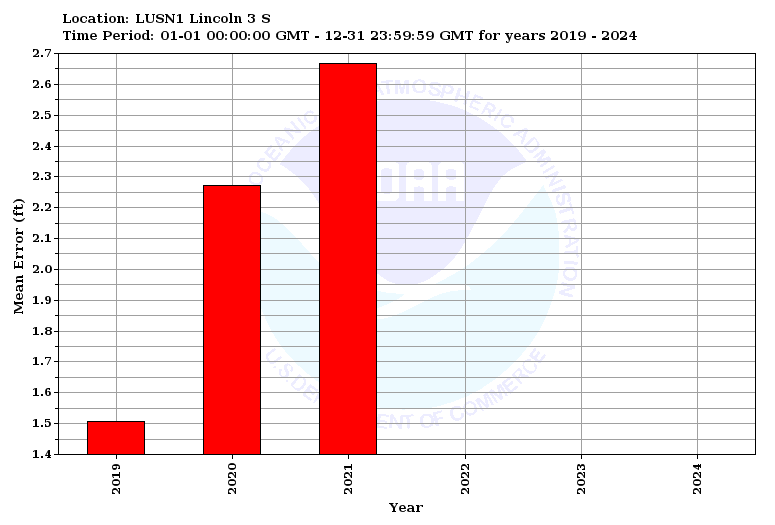
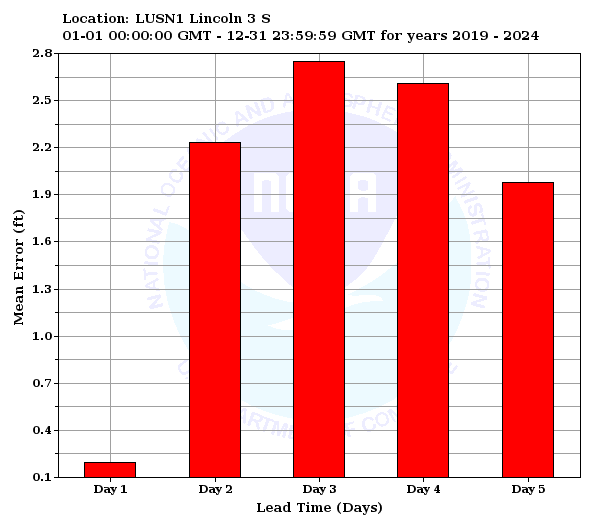
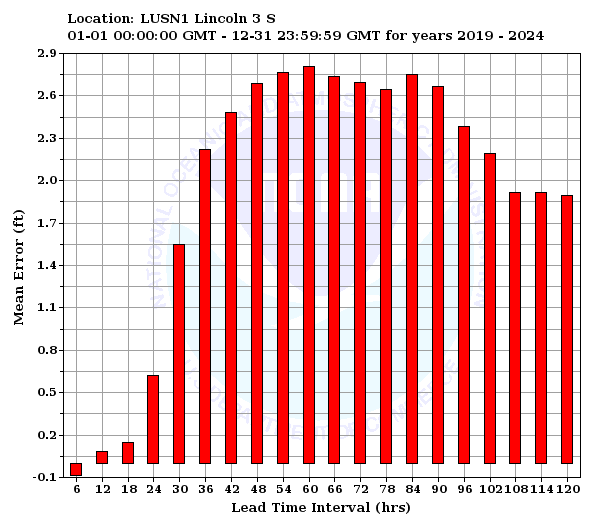
Mean Error is the average error between the forecast and observed value for each pair. The closer the value is to zero, the better the forecast.
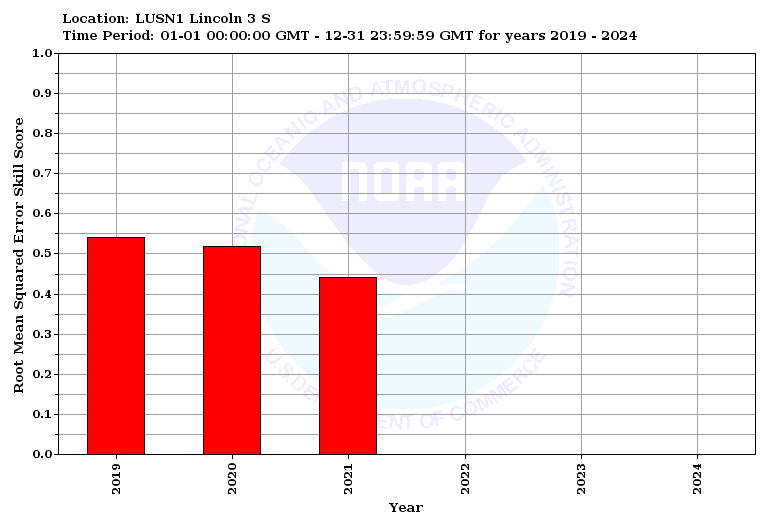
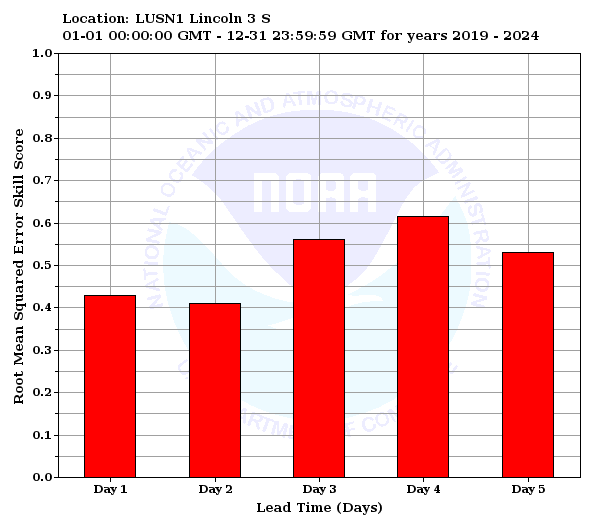
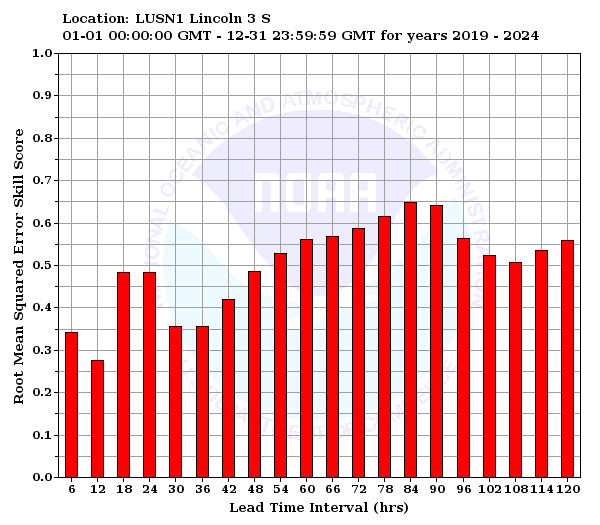
The RMSE skill score is computed as a comparison to a persistance forecast. A persistence forecast is a forecast that takes the most recent observed value and extends to forecast out at that value. A value of 1 implies perfect skill, while a value of 0 implies no additional skill over a persistence forecast. Any value greater than zero shows an improvement over persistence. Any value less than zero shows that the forecast is worse than persistence.
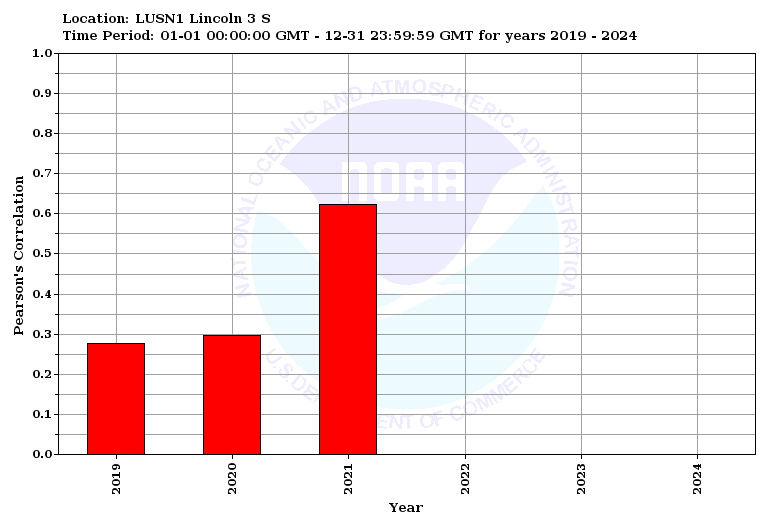
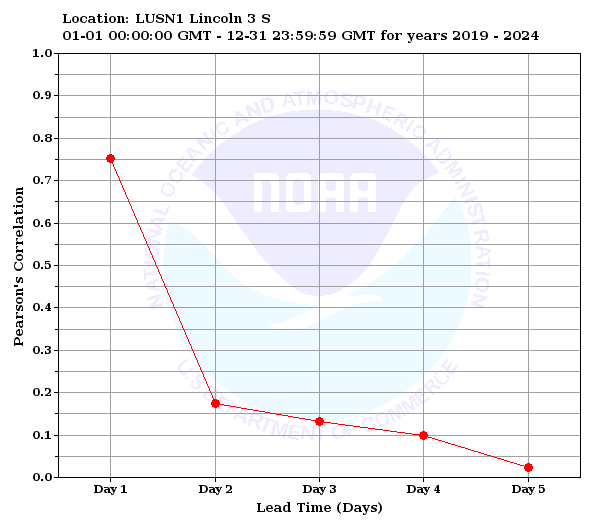
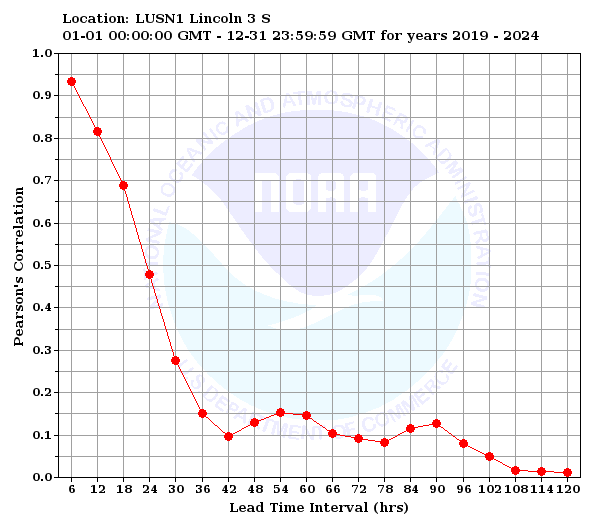
Pearson's Correlation is the covariance of the forecasts and observations divided by the product of their individual standard deviations. A value of one is ideal.
The probability of detection displays the probability that given an observed value in a category (greater than flood stage in this case), that the forecast value also falls in that category. A value of 1 depicts that 100% of the time the forecast and observed values will fall in the same category and is the most desired.
The hydrologic false alarm rate displays the probability that, given a forecast value within a category (greater than flood stage in this case), that the observed value is below that category. A value of 0 is ideal and depicts that a forecast is never issued above flood stage that the observed is not above flood stage.
Noteable River Forecast Center MilestonesQPF Usage
River Model Used
River Model Timesteps
River Forecast Issuance
|

