|
As the below graph shows, the 12.12 inches of rain that fell in Lubbock ranks as the second wettest May on record, only falling short of the 12.69 inches that was recorded way back in 1941. Impressively, May 2015 exceeded the previous second wettest May by a whopping 4.32 inches (7.80 inches in 1949). It was also the first time Lubbock received over 6 inches of rain in May since the 1960s (6.79 inches in 1963). The average rainfall for May in Lubbock is 2.30 inches, nearly 10 inches below what fell in 2015. |
|
This chart shows the top 10 wettest months on record in Lubbock. Click on the map to view a full-sized version.
|
|
The above bar graph also shows that the majority (7 out of 10) of the top ten wettest months for Lubbock occurred in the late summer and early fall months of August, September and October, though May and June also contain three of the top ten, including two of the top three. |
|
This chart shows the history of May rainfall at Childress. Click on the map to view a full-sized version.
|
|
Even more impressively, Childress not only exceeded its wettest May on record, it also set a new all-time wettest month on record in 2015 by tallying 13.21 inches. This beat the previous record by a full 1.16 inches (12.05 inches in June of 1941). May 2015 brought only the second time ever that Childress recorded double digit rainfall in May (only other is 10.28 inches in 1935). The heavy rain, wet ground and cloud cover also helped keep temperatures relatively cool, with neither Lubbock nor Childress recording a single 90 degree day through the entire month of May. |
|
This chart shows the top 10 wettest months on record in Childress. Click on the map to view a full-sized version.
|
|
The above bar graph also shows that in contrast to Lubbock, the top 10 wettest months at Childress are roughly evenly divided between Spring and Autumn. Interestingly, 7 of the top ten events came during the first half of of the historical record (before 1950). The wet May brought a welcome change to the water budget of West Texas, which had been dominated by drought and low water levels the past few years. The charts below show the progression of drought conditions across the state of Texas for roughly the past year. In May of 2014, much of the South Plains of West Texas was in an extreme drought. Precipitation last summer to this spring significantly eroded the drought conditions, then the heavy rains in May for the most part eliminated the remaining drought. |
 |
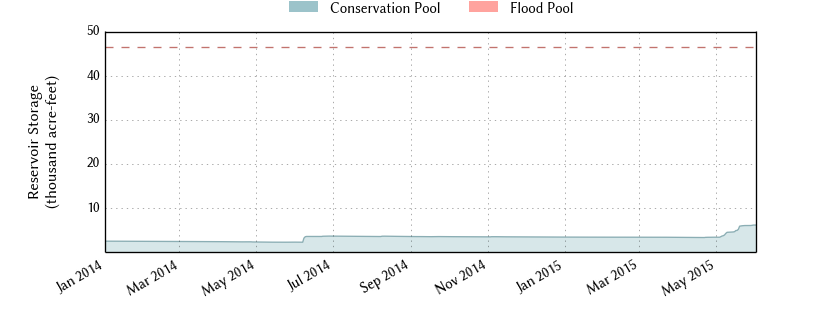
| Graph of the water levels at Mackenzie Reservoir. This graph is courtesy of the Texas Water Development Board (https://www.waterdatafortexas.org/) |
|
|
 |
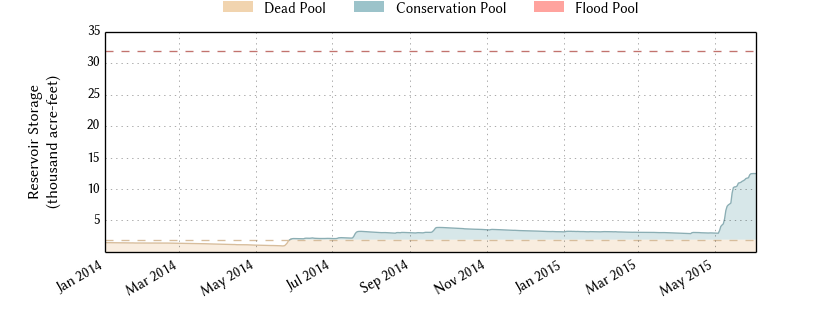
| Graph of the water levels at White River Lake. This graph is courtesy of the Texas Water Development Board (https://www.waterdatafortexas.org/) |
|
|
 |
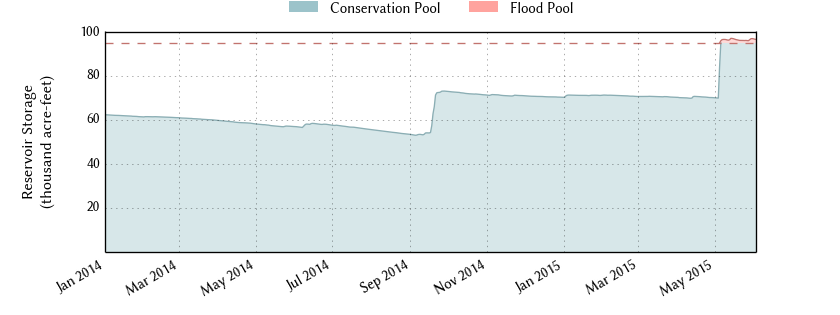
| Graph of the water levels at Lake Alan Henry. This graph is courtesy of the Texas Water Development Board (https://www.waterdatafortexas.org/) |
|
|