 Email the authors
During the overnight hours of July 29th into July 30th, 2024, slow-moving thunderstorms brought torrential rainfall to portions of Orleans, Caledonia, and Essex counties. Rainfall totals across these areas ranged from 4 to 8 inches, with intensities exceeding 2 inches per hour over an extended period. This intense rainfall resulted in rapid and severe flash flooding. Post-event flood surveys conducted by the National Weather Service (NWS) in Burlington identified the towns of Morgan, Lyndon, and St. Johnsbury as some of the hardest hit, with significant destruction reported: 42 homes and 16 bridges were destroyed, and numerous roads were washed out. Several landslides also occurred in the region.
This event review is structured as follows. Section 2 provides an analysis of the synoptic and mesoscale environment that contributed to the heavy rainfall and subsequent flooding. Section 3 examines the hydrological conditions favorable for flooding, incorporating findings from the NWS Burlington flood surveys, which are detailed in Section 4.
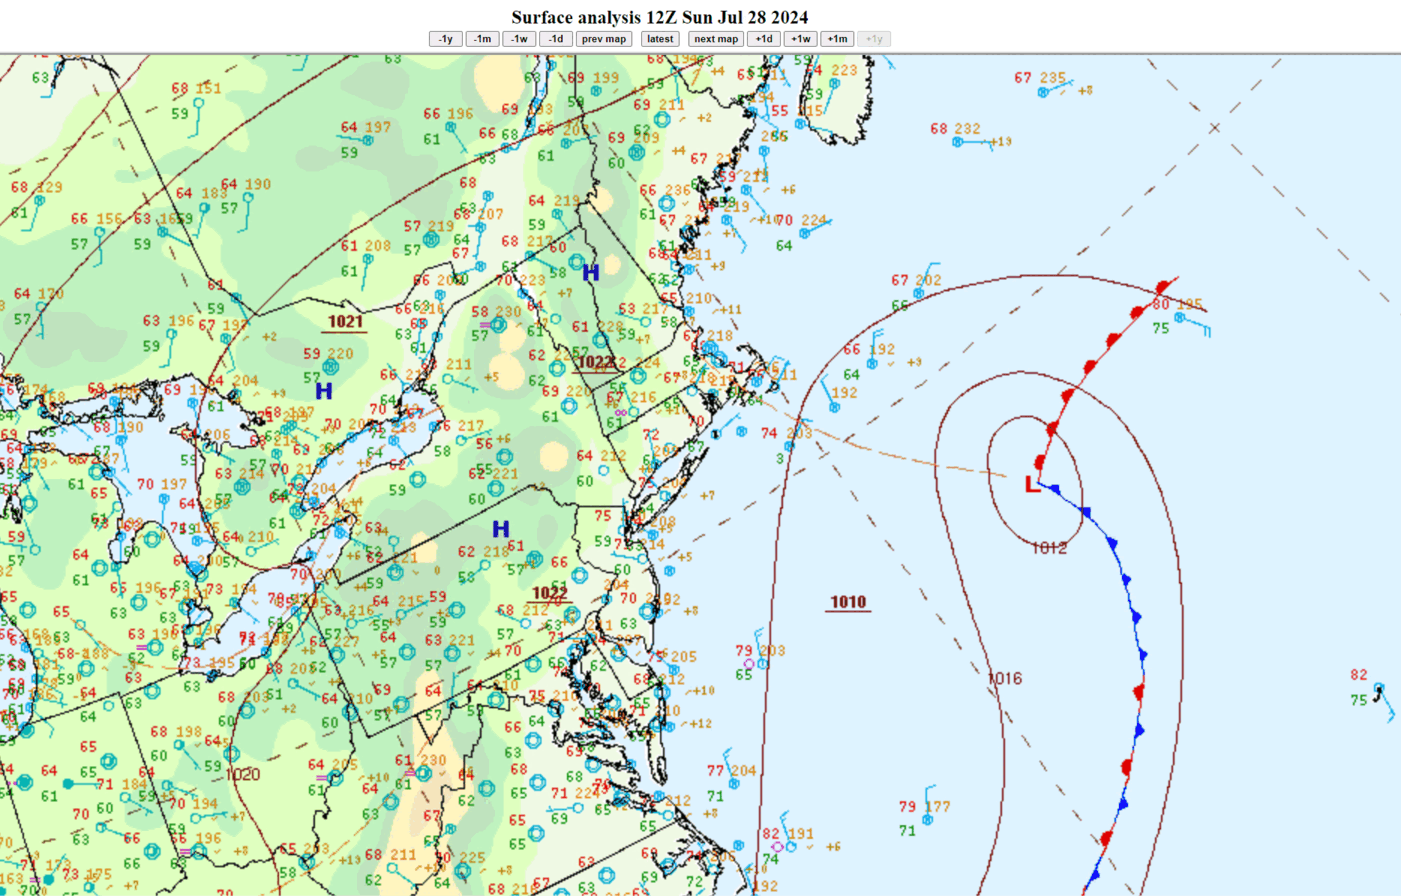
The flash flooding in Vermont's Northeast Kingdom during the pre-dawn hours on July 30th was driven by an unseasonably strong mid-upper level low pressure system that formed southeast of New England and retrograded northwest over the preceding 48-72 hours. On July 29th, the 500mb low was located near Long Island and the south coast of New England, with negative height and temperature anomalies compared to late July climatology (Figure 1). An attendant surface low was located well southeast of the 40N 70W benchmark at 12Z (8 AM EDT) on July 28th (Figure 2a), but would gradually weaken while moving toward the Maine coast (Figure 2b) and generally dissipating inland across New England by 06Z (2 AM EDT) on July 30th (Figure 2c). Surface features during the heavy rainfall period were largely unremarkable, presenting forecasting challenges; there were no significant surface boundaries to organize precipitation.
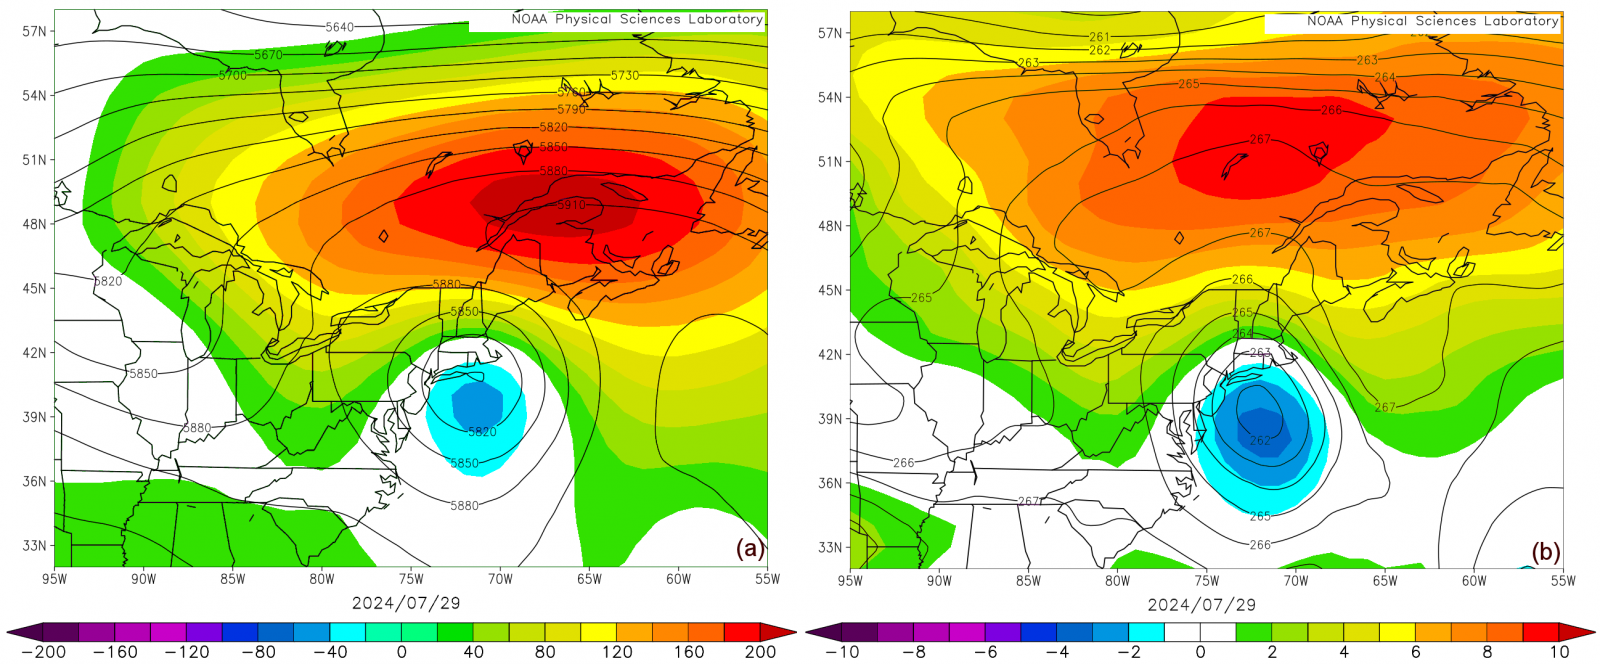
Figure 1. The North American Regional Reanalysis (NARR) mean 500mb (a) geopotential height (solid lines) and geopotential height anomalies (color filled) in meters, and (b) mean temperature (solid lines) and temperature anomalies (color filled) in Kelvin for 29 July 2024. The anomaly fields are computed against the 1981-2010 climatology based on National Centers For Environmental Prediction (NCEP) Reanalysis data. [click to enlarge]
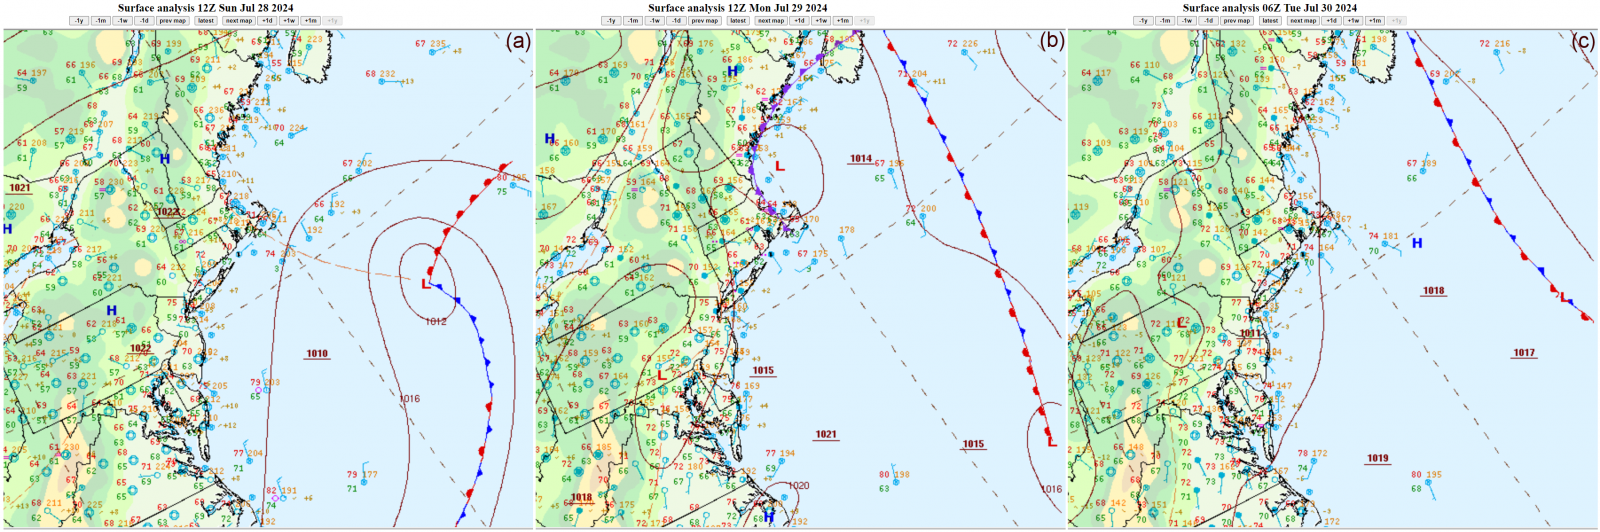
Figure 2. Weather Prediction Center surface analysis valid at (a) 12Z on 28 July 2024, (b) 12Z on 29 July 2024, and (c) 12Z on 30 July 2024. >Click here to see a loop of surface analysis maps in 3-hour intervals from 12Z on 28 July 2024 through 12Z on 30 July 2024.[click to enlarge]
A ~20-hour loop of mosaic composite reflectivity is shown in Figure 3. The center of circulation at 500 mb reached the south coast of New England and eastern Long Island during the morning hours on July 29th. The system then tracked north-northwestward across central New England, with a cold core and temperatures of -12C to -13C. The cold pool aloft likely enhanced mid-level lapse rates, bolstering daytime heating and instability, leading to isolated thunderstorm development mainly across the southern half of Vermont. SBCAPE values generally reached 1000-2000 J/kg with peak daytime heating the afternoon of July 29th.
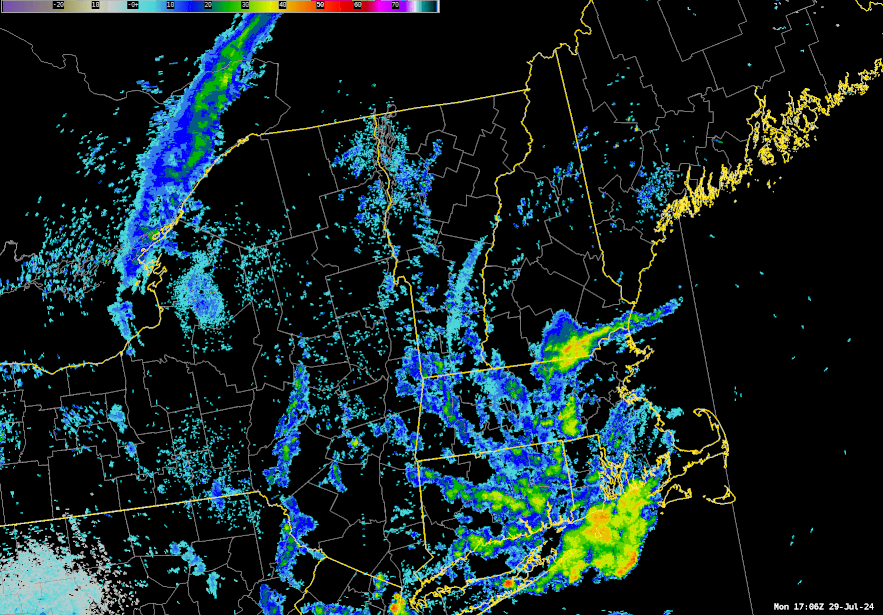
Figure 3. Mosaic composite reflectivity (dBZ) loop from 1706Z (106 pm EDT) on 29 July 2024 through 1300Z (9 am EDT) on 30 July 2024.[click to enlarge]
Overnight, the core of the upper low moved northward across the upper Connecticut River Valley between 05-11Z (1-7am EDT) on July 30th. A new cluster of thunderstorms formed near the mid-level circulation center and to its west, producing extremely heavy rainfall. A look at this convective evolution is shown in Figure 4 via the Multi-Radar Multi-Sensor reflectivity product. The upper low weakened and ultimately transitioned to an open wave and exited toward northwestern Maine by the afternoon of July 30th, as it encountered a prevailing large ridge axis to the north (Figure 1). Despite the heaviest rainfall occurring during the overnight hours, SBCAPE values of 500-1000 J/kg persisted, while precipitable water values of 1.5 to 1.6 inches were recorded over northeastern Vermont. According to Storm Prediction Center Sounding Climatology for Albany, New York, these values fell between the 75th and 90th percentiles for late July, although they were below the historical extremes (which exceed 2 inches). The water vapor imagery (Figure 5) reveals well the cluster of thunderstorms developing near the mid-tropospheric circulation center across northeastern Vermont during the overnight period.
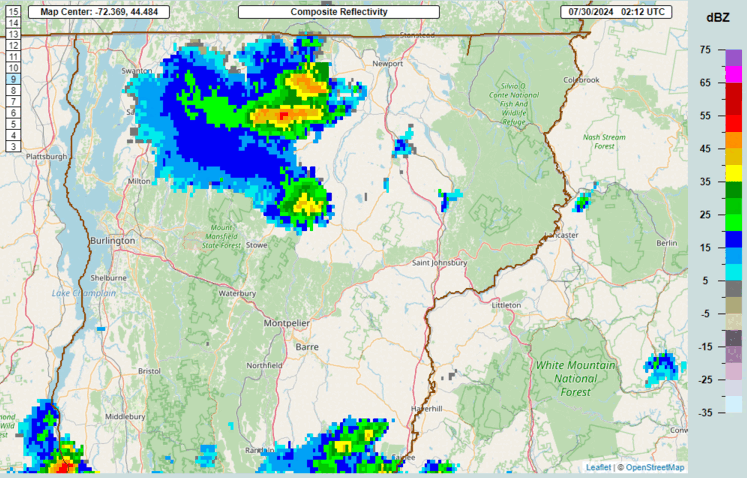
Figure 4. MRMS composite reflectivity (dBZ) centered over northern Vermont for the period 0212-1012Z on 30 July 2024.[click to enlarge]
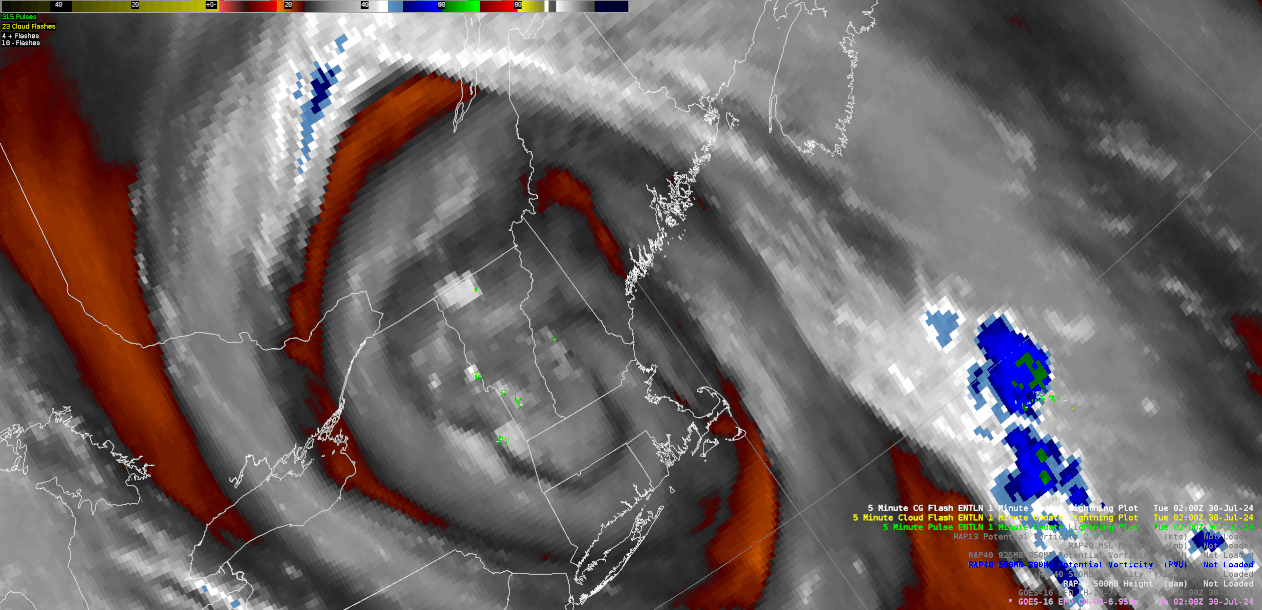
Figure 5. GOES-16 water vapor imagery loop and 5-minute lightning flashes for the period 02Z through 1050Z on 30 July 2024. The 500-mb geopotential heights (dm) and potential vorticity (PVU) are overlaid from the closest corresponding initial-hour analysis from the Rapid Refresh (RAP) model.[click to enlarge]
Heavy rain was localized and climatologically extreme for Northeastern Vermont. The Northeast Kingdom is characterized by complex terrain, with mountains exceeding 3000 ft and the Passumpsic River Valley and its tributaries extending from north of Lyndonville to St. Johnsbury to Passumpsic, before flowing into the Connecticut River north of Barnet, Vermont (Figure 6). The steep terrain and small, flashy river basins make the region susceptible to flash and river flooding.
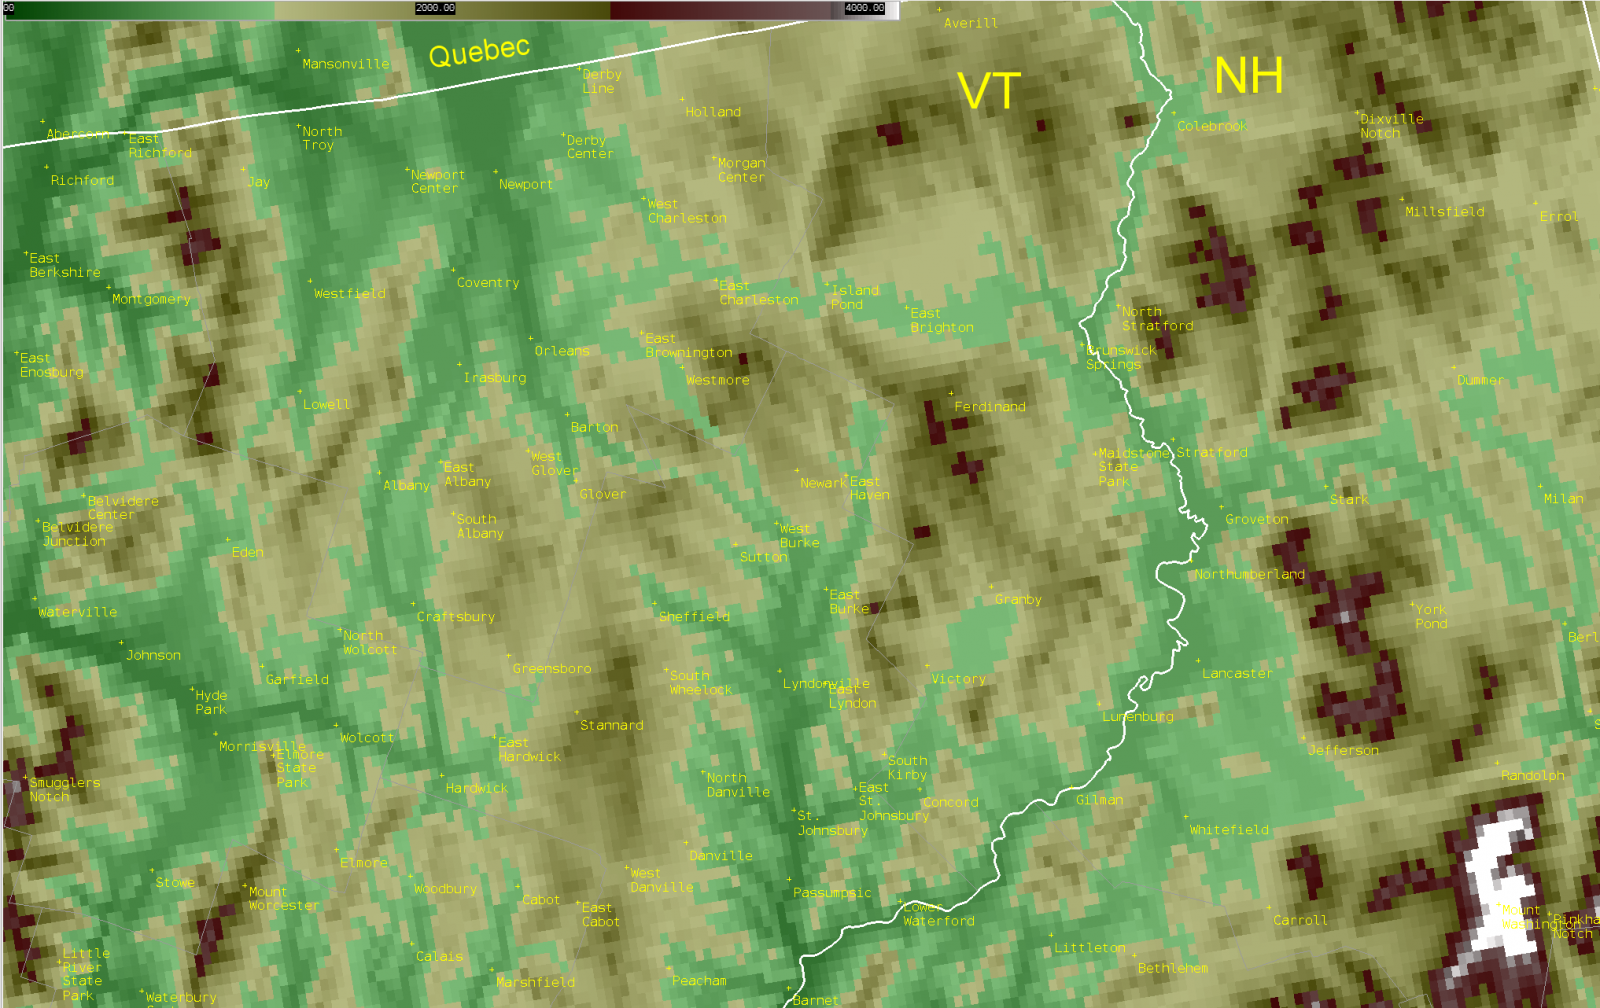
Figure 6. A topographic map (legend at the top of the image shows terrain height in feet) with cities and towns overlaid over northeastern Vermont and adjacent portions of northern New Hampshire and southern Quebec.[click to enlarge]
Rainfall exceeded 6 inches across portions of three counties - Caledonia, Essex, and Orleans (Figures 7 and 8). At St. Johnsbury, rainfall commenced prior to midnight, yielding 3.56” by 2 am EDT (06Z) and 7.96” by 5 am EDT (09Z). A total of 8.04” was observed at the St. Johnsbury ASOS in total (Figure 9). St. Johnsbury is also a cooperative observer site, with records at the Fairbanks Museum dating back to 1894. The cooperative observer recorded 8.08” with this event, shattering the previous calendar day record of 4.99” on July 28, 1913 (Figure 10). This event followed another significant rainfall just 18-19 days prior (4.93 inches on July 11, 2024), contributing to already saturated soils and exacerbating runoff and flooding during this event.
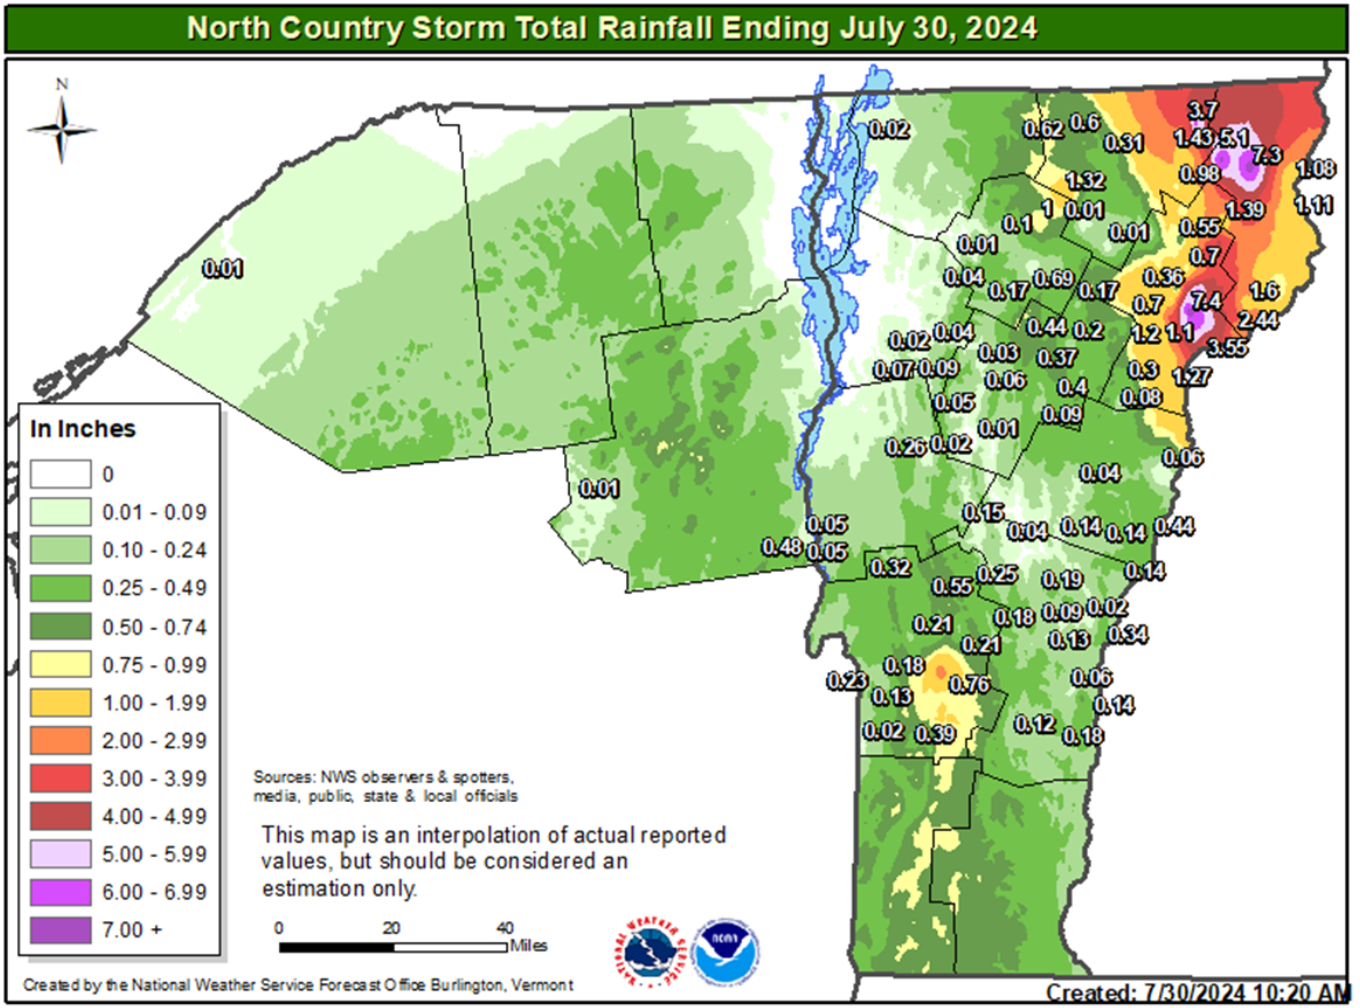
Figure 7. Observed rainfall amounts (in inches) for the 24 hour period ending at 12Z (8 am EDT) on 30 July 2024.[click to enlarge]
>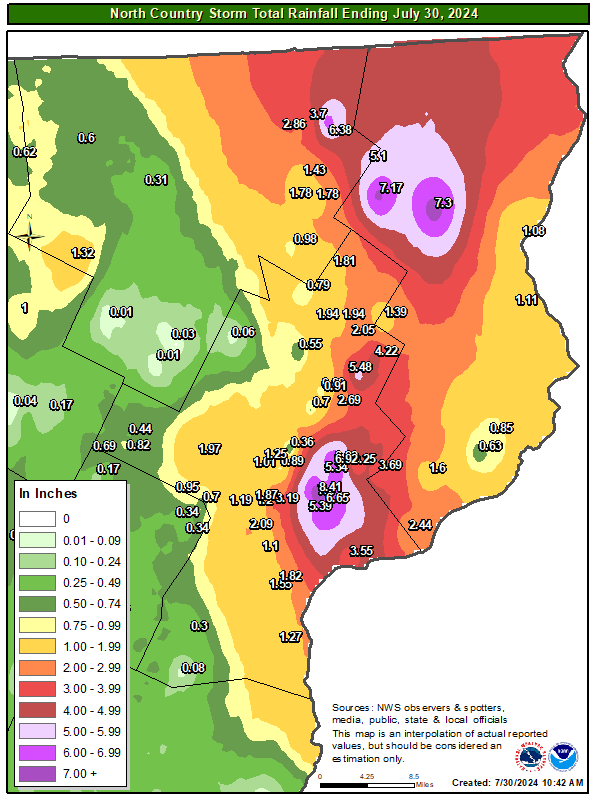
Figure 8. As in Fig 7., except zoomed in across Vermont's Northeast Kingdom.[click to enlarge]
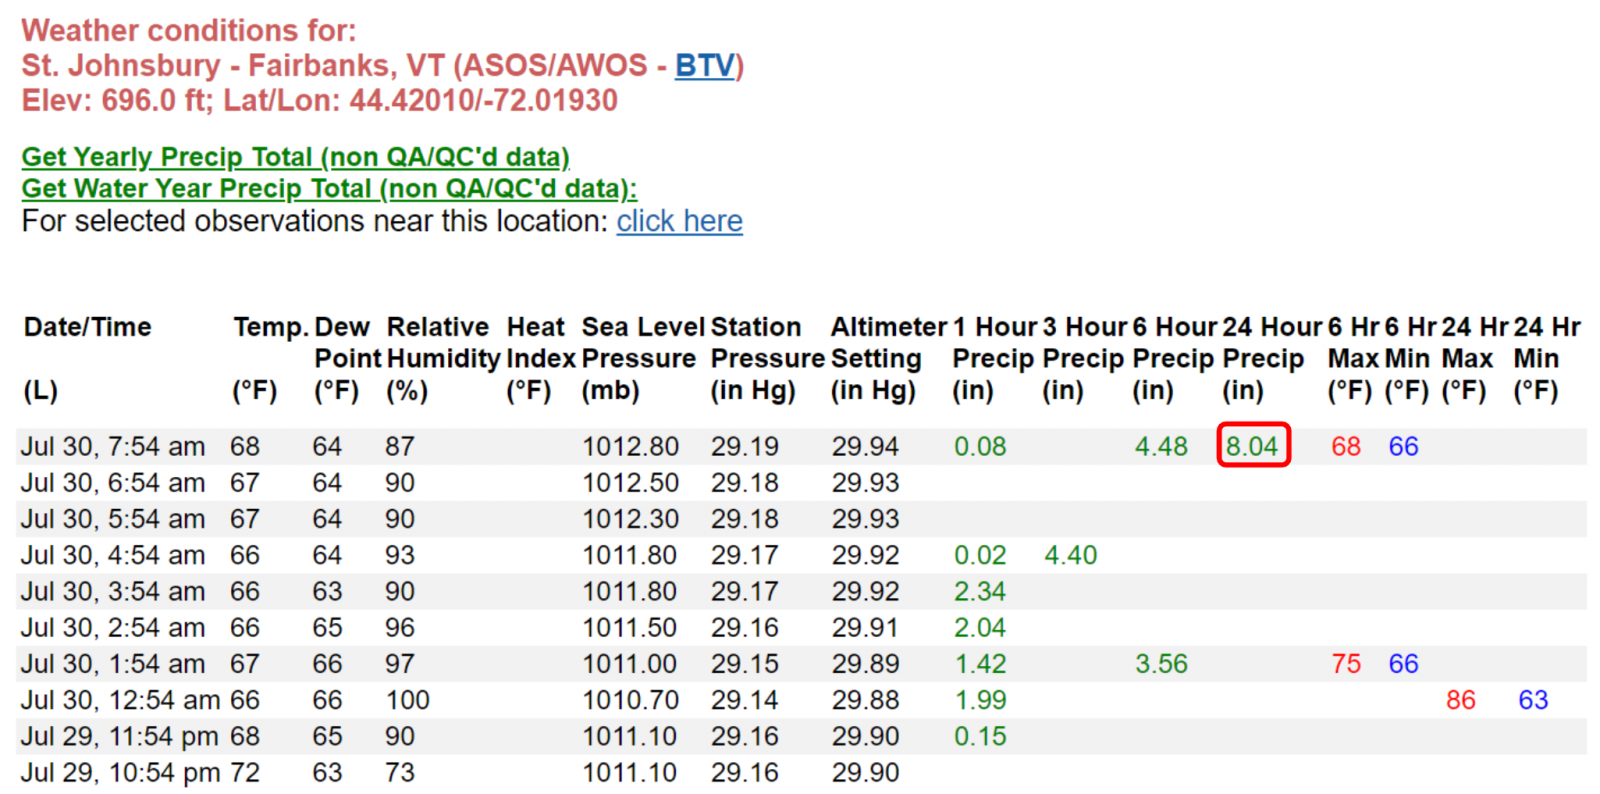
Figure 9. Table showing decoded weather observations from the ASOS in St. Johnsbury, Vermont (K1V4). Rainfall intensity peaked between 2 and 4 am EDT (06-08 Z) when rainfall rates exceeded 2”/hr at K1V4. [click to enlarge]
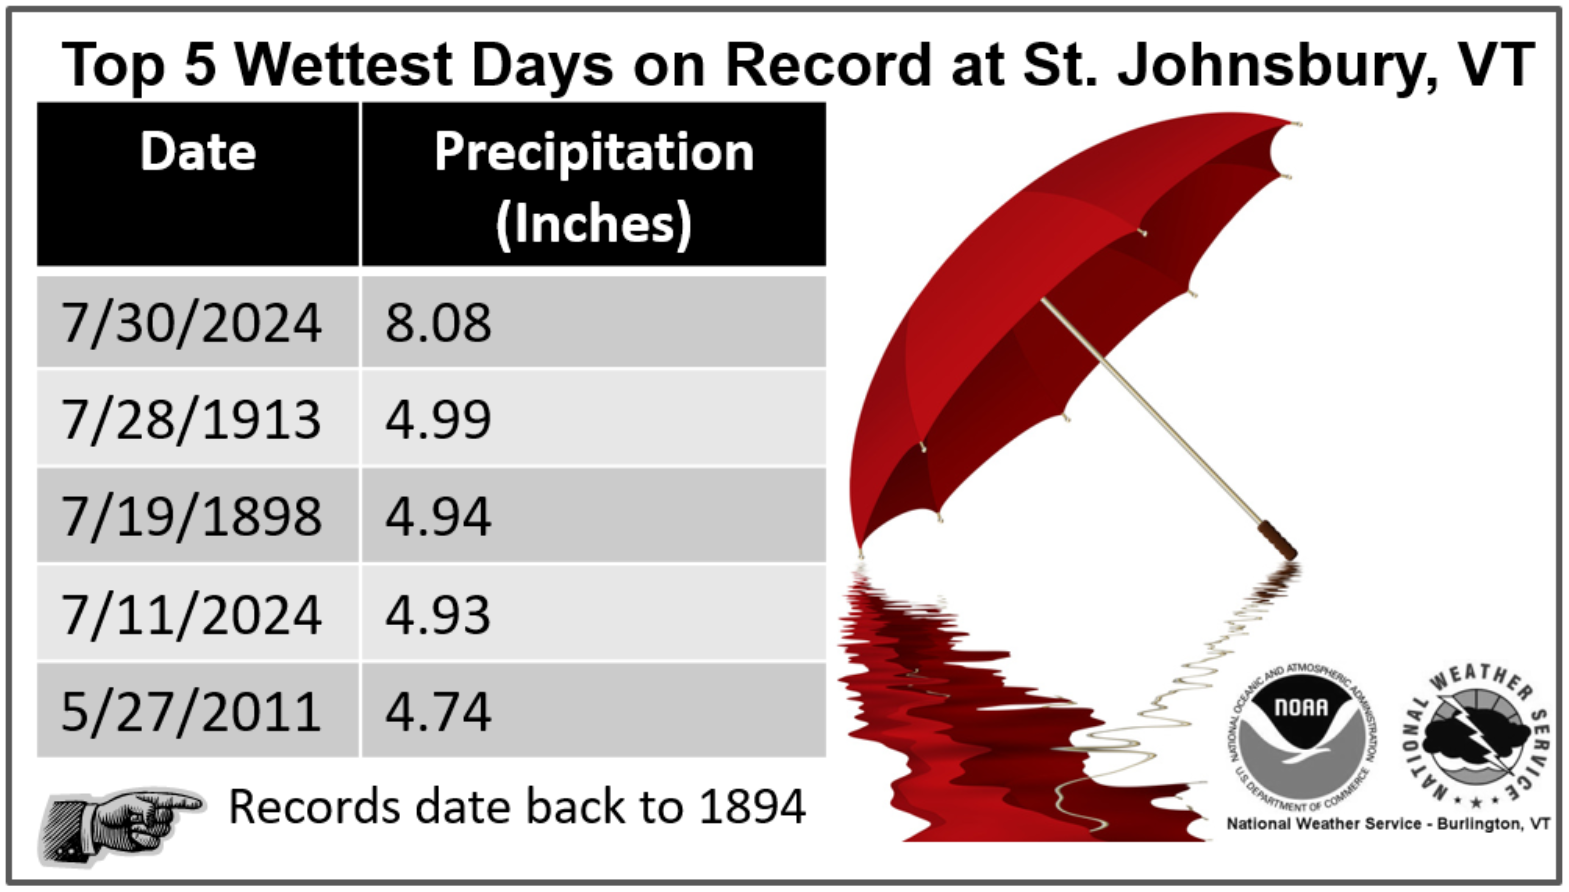
Figure 10. Table showing the top 5 wettest days on record for the NWS Cooperative Observer site at the Fairbanks Museum and Planetarium in St. Johnsbury, Vermont (SJBV1).[click to enlarge]
While modest instability and a humid environment persisted overnight, in the absence of surface boundaries, it is difficult to determine exactly why thunderstorms developed and exhibited upscale growth in the middle of the night. The nocturnal thunderstorms were closely associated with the upper low pressure system (Fig. 5). Once the initial thunderstorms developed in the area, it's possible that nocturnal, longwave radiative cooling at cloud top level increased instability in the upper troposphere, supporting stronger upward motion in the convective cells and prolonging the life cycle of the thunderstorm cluster. Nocturnal intensification of convective systems through radiative processes is sometimes observed in both mid-latitude mesoscale convective systems (MCSs) (Houze 2018) and in tropical cyclones (Tang and Zhang 2016).
Climatological context
As mentioned above, one of the most remarkable aspects of this event was the extreme rainfall amounts observed. To gauge the anomalous nature of heavy rainfall episodes, particularly in regard to specific return intervals, the NOAA Atlas 14 Point Precipitation Frequency Estimates can be instructive. Taking the St. Johnsbury automated surface hourly observations from NWS ASOS instrumentation as an example, the maximum hourly and multi-hour rainfall amounts were as follows:
1 hour max - 2.34 inches
2 hour max - 4.38 inches
3 hour max - 5.80 inches
6 hour max - 7.96 inches
12 hour total - 8.04 inches
Using these totals, and plotting them on a partial duration series-based depth-duration frequency curve from NOAA Atlas 14 yields the following chart. As the plot demonstrates, while the maximum 1-hourly amount of 2.34 inches observed at St. Johnsbury lies somewhere near a 100-year event; the 2, 3, 6 and 12 hour max values all exceed a 1000-year event for the town (Fig. 11). Other areas, such as Morgan, Island Pond and Lyndon saw slightly less, but still extreme totals.
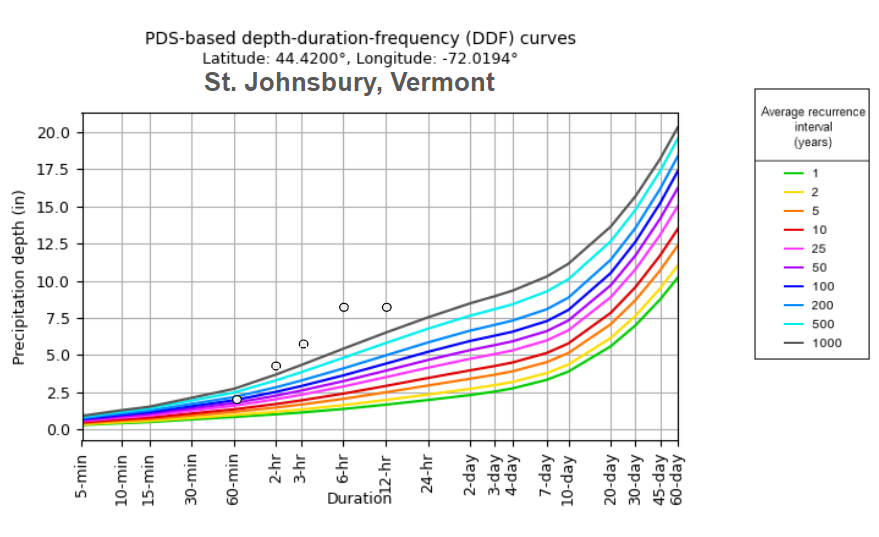
Figure 11: NOAA Atlas-14 annual recurrence intervals of 2, 3, 6 and 12 hour rainfall amounts observed in St. Johnsbury, VT on July 30, 2024, suggesting a greater than 1000-year event on these time scales.[click to enlarge]
Leading Causes of Flash Flooding
There are a myriad of factors that lead to an area's susceptibility to flash flooding. One of the primary causes is rainfall rates. If heavy rainfall falls in a shorter duration time frame, small to medium sized watersheds have less ability to naturally route water downstream. For example, 3 inches of rainfall in an hour poses a considerably more serious flash flood threat than 3 inches in 24 hours. In general, smaller creeks and streams are typically more prone to flash flooding than larger ones. However, overall severity can vary. In some cases, slightly larger watersheds can experience more extreme flash flooding than smaller ones, especially in steep, channeled terrain or when debris flows alter the water course. Other important factors that drive the flash flooding threat are antecedent soil moisture conditions, watershed geomorphology, urbanization, and steepness, or slope of the watershed. If the soil is wet or nearly saturated prior to the onset of heavy rainfall, its capacity to absorb additional rainfall is limited and runoff is enhanced. If, for example, a watershed is heavily urbanized, surfaces such as paved parking lots and roads act to create a semi-impervious barrier to rainfall infiltration into the ground, leading again to fast runoff response. In steeply sloped or channeled watersheds, runoff from rainfall is enhanced by the process of gravity whereby the average channel flow speed is already naturally high. When a heavy rainfall event affects the watershed, this efficiency can unfortunately lead to rapid water rises and potential flash flooding. Finally, other factors such as variability in rainfall distribution, debris flows in the stream channel during high flow events, and impervious soils due to burn scars from forest fires can also heavily contribute to the flash flooding threat.
Flash Flooding Analysis in St. Johnsbury, Lyndon and Morgan, Vermont
During the height of the event, numerous small and medium-sized watersheds experienced flash flooding of varying severity across portions of Orleans, Essex and Caledonia Counties. The most significant areas were in the St. Johnsbury, Lyndon and Morgan/Island Pond, VT areas which are described in detail below.
St. Johnsbury
The town of St. Johnsbury had the unfortunate distinction of receiving the highest rainfall totals, and some of the more severe flash flooding observed in the region. While numerous small streams experienced flash flooding, a few specific areas were particularly hard hit. These included the Spaulding Brook watershed, the Roberts Brook watershed, and two small, unnamed watersheds. The first of these enters the Passumpsic River near the intersection of Concord Avenue and Gilman Avenue. The second flows directly into the Moose River near Pettyco Junction and the Moose River Campground (Fig. 12). The drainages of these latter two watersheds are both steep and under two square miles in area, leading to their susceptibility of extreme high flows during heavy rainfall events. In fact, the Moose River Campground has experienced flash flooding in the past. Considerable to severe damage was observed in the lower portions of these drainages where they enter the Passumpsic and Moose Rivers respectively (Figs. 13 and 14). The Spaulding Brook and Roberts Brook watersheds are slightly larger (~ 3 sq. mi.), the latter of which is known to have a history of flash flooding. Similar to the smaller drainages discussed above, locally severe damage was noted in the lower portions of the watersheds. This was particularly evident where Roberts Brook crosses Memorial Drive (US Route 5) and enters the Passumpsic River. Here, several businesses were severely damaged by flash flooding with high water marks of one to two feet observed during NWS Burlington storm surveys. The local bridge on Memorial Drive was also destroyed at this location (Figs. 15 and 16).
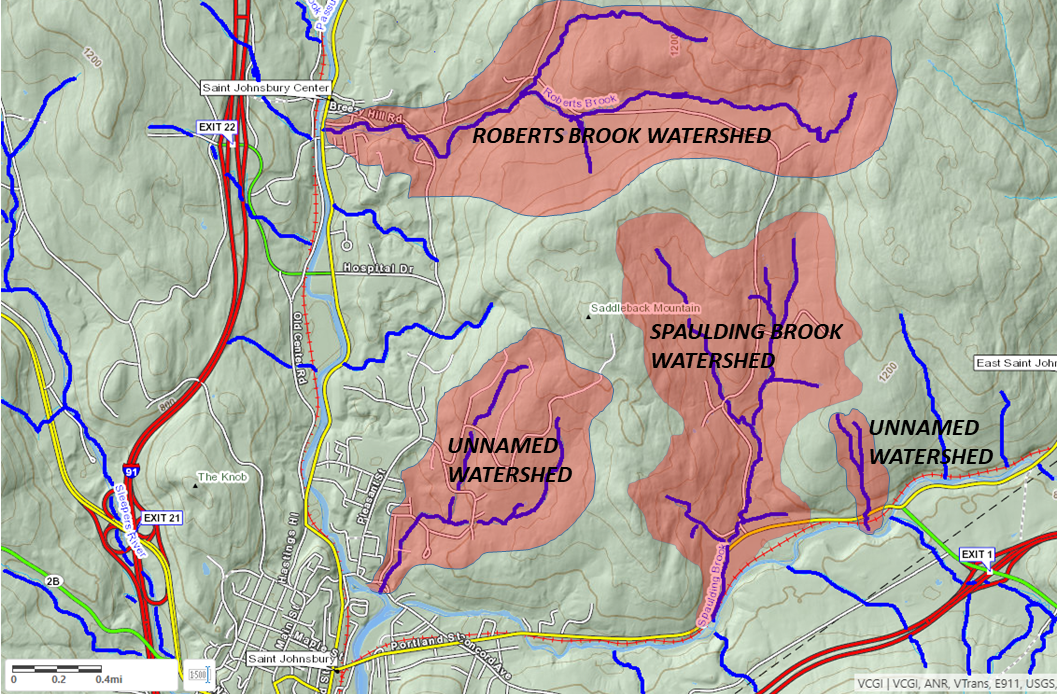
Figure 12. Approximate watershed boundaries of Spaulding Brook, Roberts Brook and two unnamed tributaries in St. Johnsbury, VT (red shading) where severe flash flooding occurred on July 30, 2024.[click to enlarge]
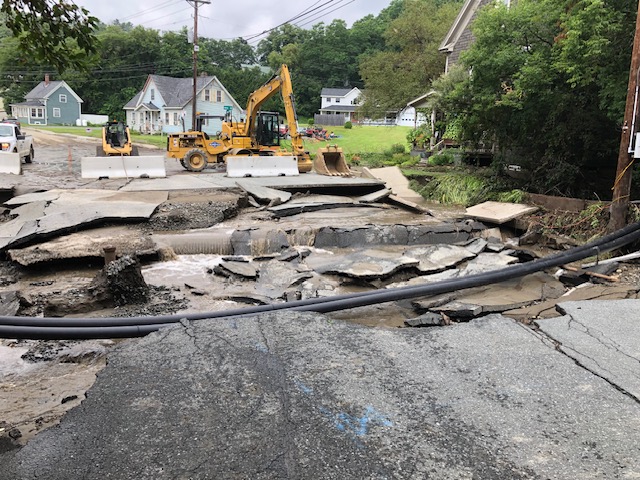
Figure 13. A destroyed bridge across an unnamed tributary to the Passumpsic River at the intersection of Concord Ave. and Gilman Ave. in St. Johnsbury (NWS storm survey photo)[click to enlarge]
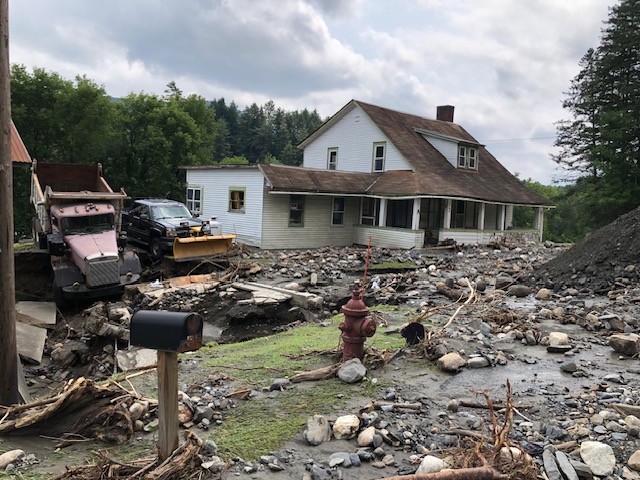
Figure 14. Severe flash flood damage shown at a home on US Route 2 near Moose River Campground in St. Johnsbury, VT on July 30, 2024 (NWS storm survey photo)[click to enlarge]

Figure 15. NWS personnel survey a high water mark at a local St. Johnsbury business along Roberts Brook on Memorial Dr. in St. Johnsbury (NWS storm survey photo)[click to enlarge]
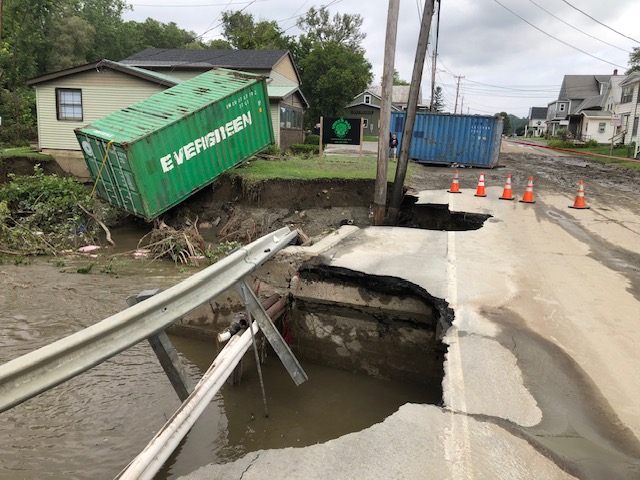
Figure 16. The bridge on Memorial Dr. (US Route 5) is destroyed by severe flash flooding along the Roberts Brook in St. Johnsbury, VT (NWS storm survey photo)[click to enlarge]
Lyndon
Perhaps the most severe to catastrophic flash flooding was observed in the town of Lyndon where five homes were destroyed and 20 to 30 others experienced other various degrees of damage. While numerous areas were impacted, the severity of damage observed in the Sheldon/Hawkins Brook watershed along Red Village Road, and in the Mountain Brook watershed along Brook Road were unsurpassed (Fig. 17). Both of these tributaries of the Passumpsic River are larger watersheds than the unnamed tributaries described in the St. Johnsbury area, in excess of 10 sq. mi in the case of Sheldon/Hawkins Brook. The larger nature of such drainages can often increase the overall storage capacity during heavy rainfall events, thus lowering the overall intensity of flash flooding. However, the myriad of factors involved in overall susceptibility of flash flooding in a particular area means that occasionally one or two can play a larger role in individual events. In the case of Sheldon Brook, debris flows significantly affected the stream channel, ultimately altering its course along Red Village Road which severely damaged and destroyed homes (Fig. 18). Along Mountain Brook, slope scouring processes lead to localized landslides which compromised and/or severely damaged homes on Brook Road (Fig. 19).

Figure 17. Approximate watershed boundaries of the Sheldon/Hawkins Brook watershed and the Mountain Brook watershed in Lyndon, VT (red shading) where severe to catastrophic flash flooding occurred on July 30, 2024.[click to enlarge]
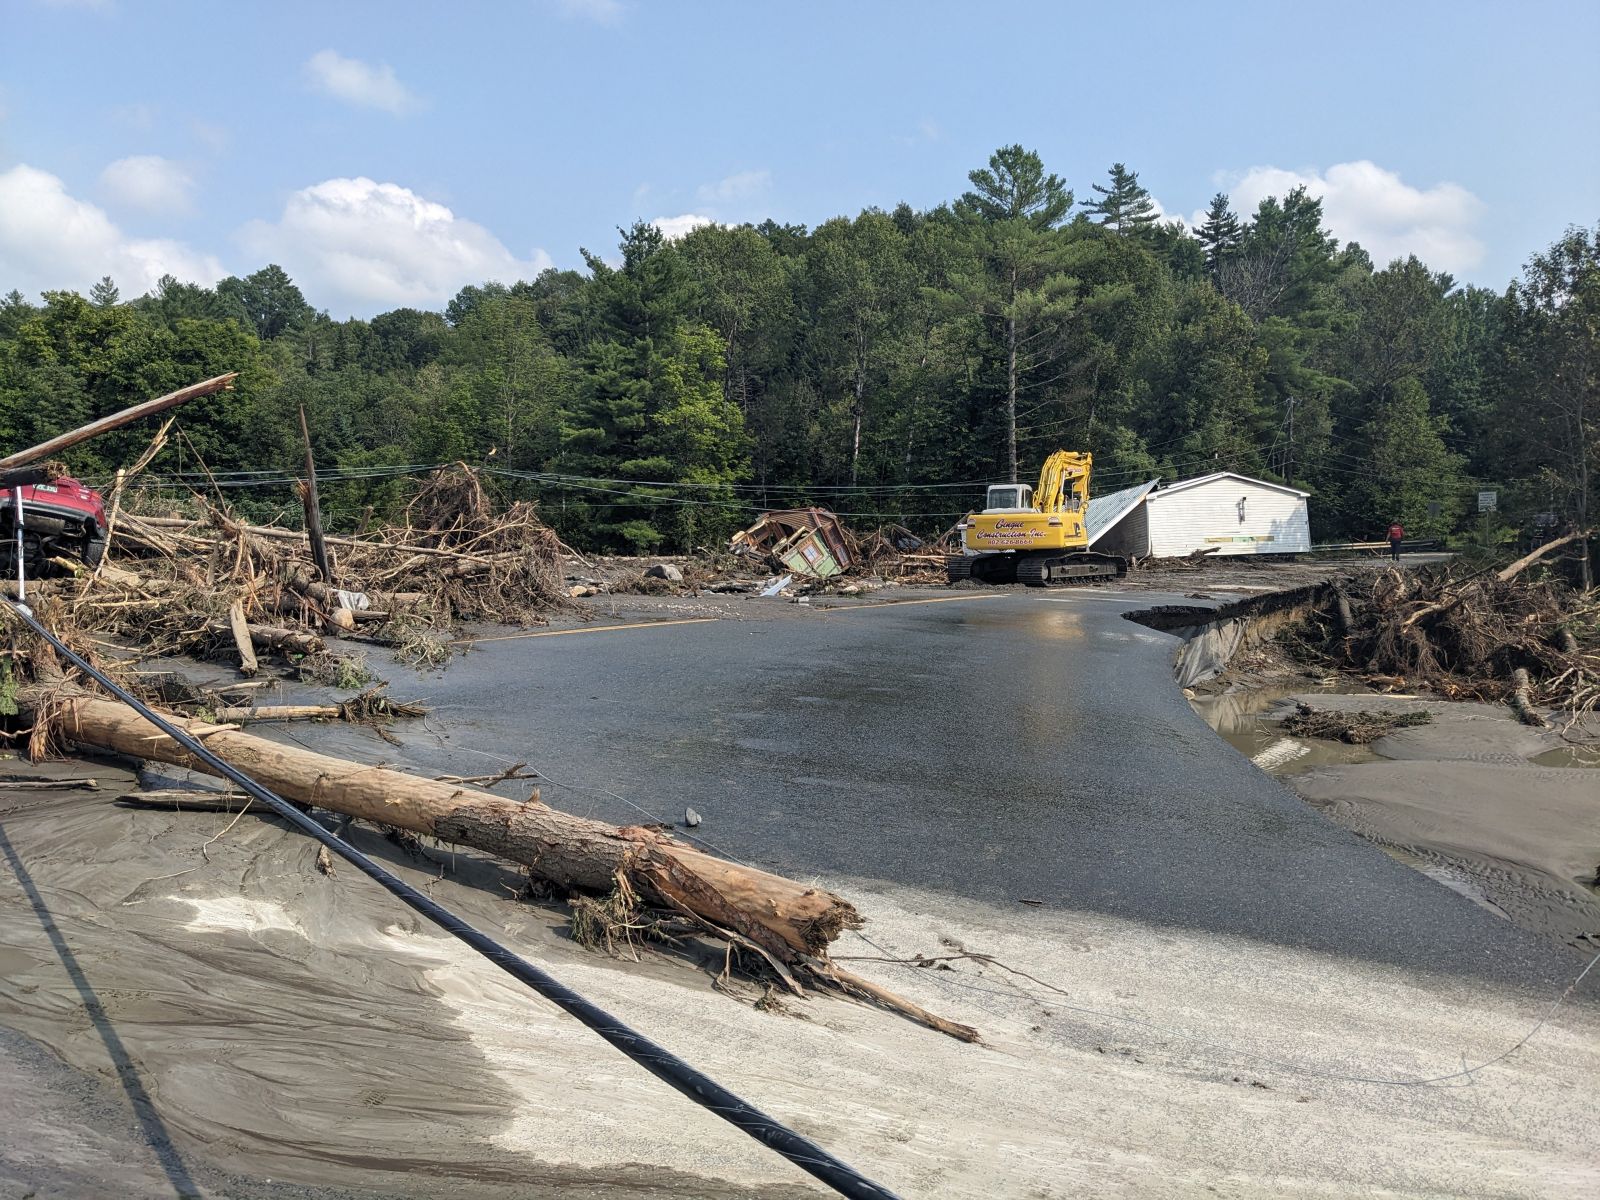
Figure 18. A destroyed home and car lie among huge debris piles along Red Village Road in Lyndon, VT after catastrophic flash flooding swept through the Hawkins and Sheldon Brook watersheds on July 30, 2024 (NWS storm survey photo)[click to enlarge]
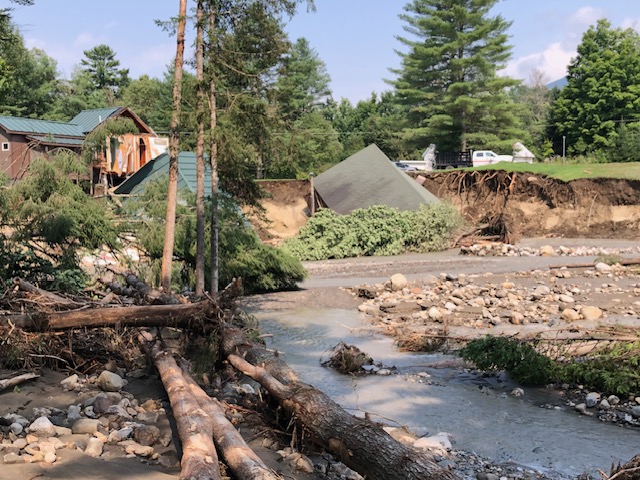
Figure 19. Extreme flash flooding in the Mountain Brook watershed led to bank collapses along Brook Road, severely damaging several homes (NWS storm survey photo)[click to enlarge]
Morgan/Island Pond
As illustrated by the rainfall map in Fig. 8, the Morgan/Island Pond was another area hard hit by some of the heaviest rainfall where amounts of 5 to 7 inches were recorded in just a few hours in the early morning hours of the 30th. Numerous roads were washed out in this area, with locally severe damage in the Brighton area along Route 105 and in Morgan along Toad Pond Road on the Sucker Brook. A few homes were also damaged by flooding in these areas, a few of which have seen prior instances of flooding over the years (Fig. 20).

Figure 20. Residents gather at the intersection of VT 111 and Toad Pond Road in Morgan Center to assess severe flash flooding on July 30, 2024 (photo courtesy Jacob Pierce via the Newport Dispatch)[click to enlarge]
Shortly after high water was receding, NWS Burlington staff led site-targeted flood damage surveys in St. Johnsbury and Lyndon on July 30, 2024. These are typically done following significant flood or flash flood events in our region. The goal of the surveys is to document damage and engage with local first responders and community members to gain a more accurate understanding of what happened. When possible, high water marks are also taken to gauge approximate maximum flow levels during the height of the flash flooding for future reference. If riverine or flash flooding occurs in the vicinity of a river gauge, subsequent documentation and work with local communities can help establish baseline flood levels and/or refine existing flood impact statements. These efforts help with community situational awareness during future flood events and aid in achieving longer-term goals of improving flood resiliency. In addition to this event, surveys were also conducted after severe flash flooding events in Vermont in July 10-11, 2024, July 9-11, 2023, and in Ellenburg, NY on July 3, 2023 (Fig. 21).
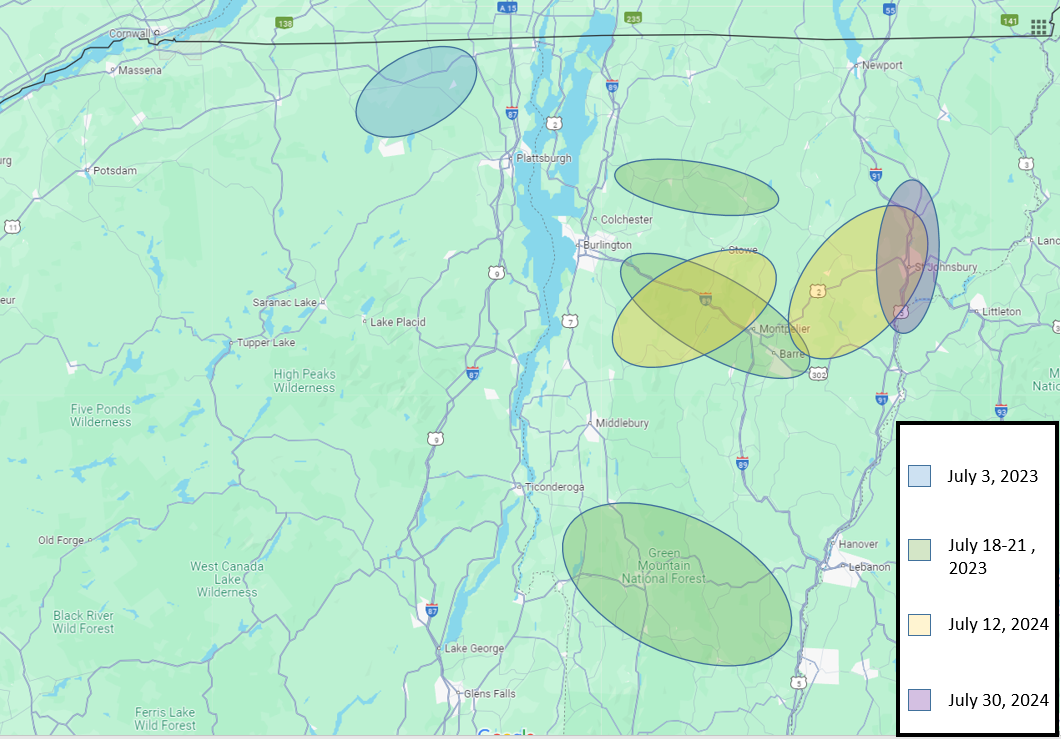
Figure 21. Approximate locations and dates of NWS Burlington flood damage surveys conducted in 2023 and 2024 in Vermont and New York.[click to enlarge]
REFERENCES
Houze, R. A. Jr., 2018: 100 Years of Research on Mesoscale Convective Systems. Meteor. Monogr., 59, 17.1-17.54, https://doi.org/10.1175/AMSMONOGRAPHS-D-18-0001.1.
Tang, X., and F. Zhang, 2016: Impacts of the diurnal radiation cycle on the formation, intensity, and structure of Hurricane Edouard (2014). J. Atmos. Sci., 73, 2871-2892, https://doi.org/10.1175/JAS-D-15-0283.1.

