Brownsville/Rio Grande Valley, TX
Weather Forecast Office
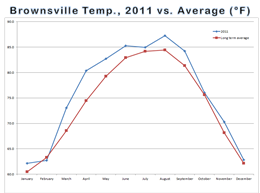
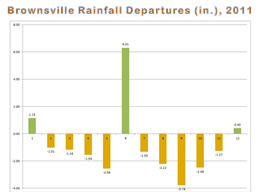
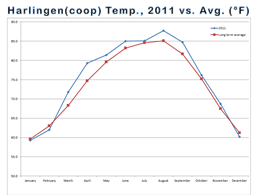
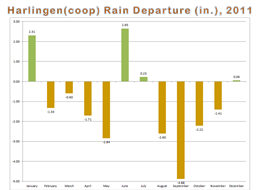
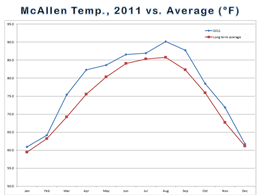
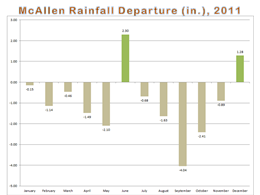
| Temperature and Precipitation Trends Brownsville, Harlingen, McAllen, in 2011 Heat and Drought were the dominant weather stories of 2011. The charts below show monthly Temperature averages (left, line charts) and Precipitation departures from average (right, bar charts) through the year. Averages and departures are based on the data sample of record, which dates back to 1878 for Brownsville, 1911 for Harlingen, and 1941 for McAllen. Almost every month was above the long term average for temperature; all but January, June, and December were below the long term average for precipitation. Most notable are the departures from average precipitation in August and September. Typically the wettest months on the calendar, the one two punch of hot, rain free late summer months not only ranked near the top of the all time charts, but ensured that reservoirs and other water supplies will continue to dwindle into spring and early summer of 2012. Water use restrictions and potential water shortages are probable come April and May, and perhaps beyond, in 2012. |
|
 |
 |
 |
 |
 |
 |
| Back to Summary | |
CURRENT HAZARDS
Daily Briefing (National)
Outlooks
Severe Weather Text
Local Storm Report
Submit a Storm Report
CURRENT CONDITIONS
Surface Observations (map)
Text Observations
Satellite
Rivers and Lakes
Observed Precip - RGV
Tides and Currents
CoCoRaHS Texas
FORECASTS
Forecaster's Discussion
Graphical
Hourly View
Activity Planner
Marine
South Padre Tides
Wave Prediction
Beach
Surf
Fire Weather
Aviation
Tropical
Winter Storm Severity Index
Model Guidance
US Dept of Commerce
National Oceanic and Atmospheric Administration
National Weather Service
Brownsville/Rio Grande Valley, TX
20 S. Vermillion Avenue
Brownsville, TX 78521
956-504-1432 (8 AM to 430 PM Mon-Fri)
Comments? Questions? Please Contact Us.

